As of today, XRP is trading at A$3.34 (US$2.16), reflecting a 2.2% decline over the past 24 hours in Australian markets. While the short-term momentum appears to lean bearish, traders are watching closely as XRP flirts with critical support and resistance levels, setting the stage for a potential breakout—or breakdown.
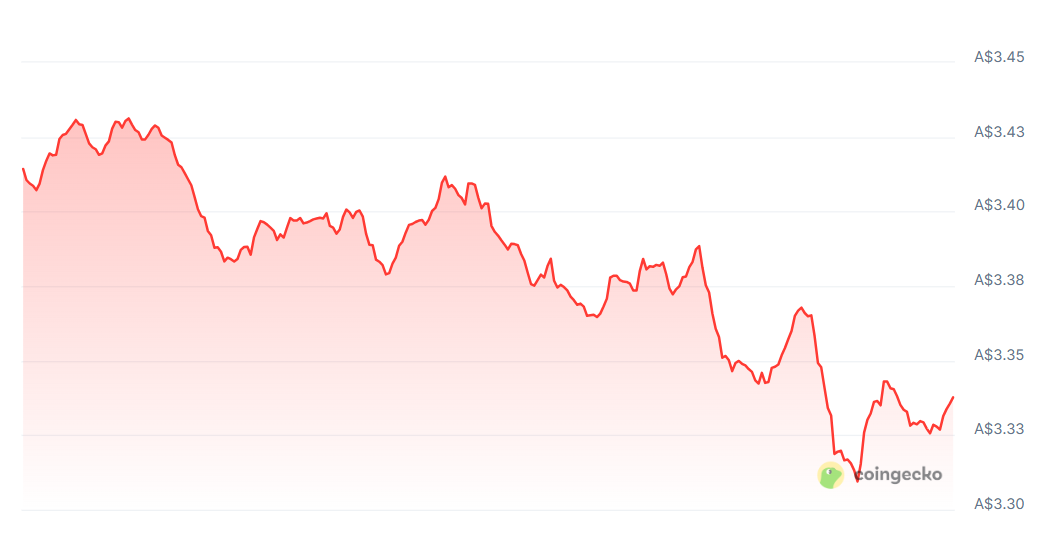
XRP Performance in AUD (CoinGecko)
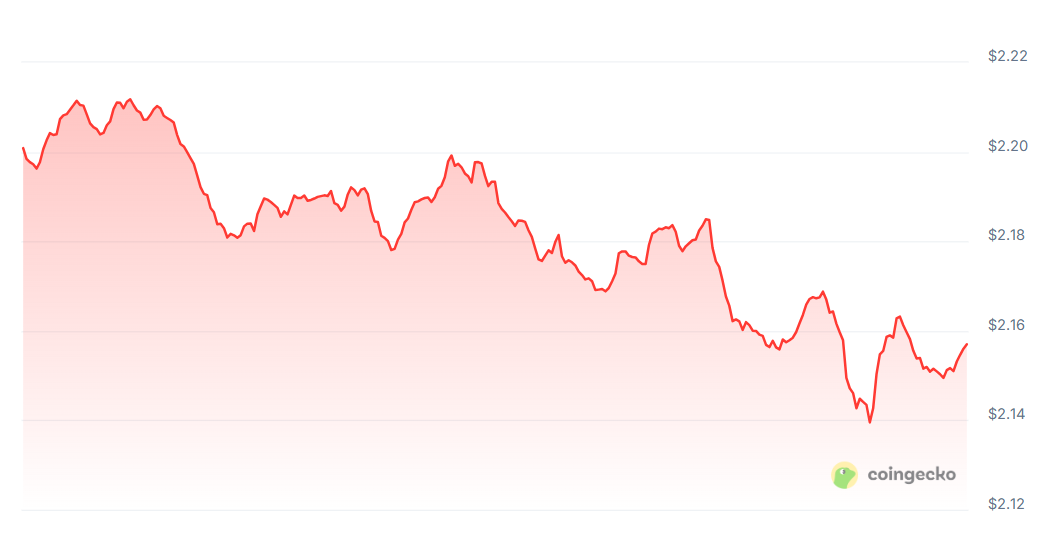
XRP Performance in USD (CoinGecko)
A Market at a Crossroads
XRP has remained under pressure since early 2025 and is now compressed between two major technical levels: a resistance around US$2.22 and key support near US$2.05. A descending resistance line has formed on the charts, and a descending triangle pattern is becoming more visible—typically a bearish formation in technical analysis. If the current support level fails to hold, the token could slip below US$2.00, with the next possible targets at US$1.85 or even US$1.70.
Despite this looming threat, XRP continues to find temporary support at US$2.05, though this level has been tested multiple times over the last few trading sessions.
Traders Turn Cautious as Sentiment Sours
According to Coinglass, the long/short ratio for XRP has remained below 1 for nearly two weeks, suggesting that a growing number of traders are betting on a price decline rather than a rebound. This persistent bearish sentiment aligns with other technical signals and market behaviours.
Notably, open interest in XRP derivatives has slightly declined, indicating that some traders are pulling back. However, derivative volume remains high, and much of it is being driven by short positions. This suggests that, although fewer positions are being opened overall, the majority of active traders expect the price to fall further.
The Relative Strength Index (RSI) stands at 47—neither overbought nor oversold—but trending downward. This neutral-to-bearish reading supports the notion that XRP could be due for more downward pressure before finding a firm base.
Price Consolidation and Potential Scenarios
XRP’s recent price action resembles a classic consolidation phase, marked by reduced volume and lower volatility. While this could signal a pause before a new trend emerges, it also opens the door to two clear scenarios:
- Bullish Breakout: If XRP manages to break past the US$2.22 resistance zone with strong volume, it could invalidate the descending triangle pattern and push toward higher levels. This would be a sign of renewed investor confidence and a shift in market sentiment.
- Bearish Breakdown: Should XRP fall below the critical US$2.00–$1.99 support zone, the bearish triangle would be confirmed, likely accelerating the sell-off. In that case, the next support zones lie at US$1.85 and US$1.70.
Broader Market Influence
XRP’s movements are not happening in isolation. Broader crypto markets are currently exhibiting mixed signals, with Bitcoin slightly down and Ethereum holding steady. In Australia, XRP/AUD sits at A$3.34, reflecting the current exchange rate and local sentiment. The price ranges between A$3.31 and A$3.43 over the past 24 hours, further emphasising the consolidation pattern.
Key Stats (as of publishing):
- XRP Price (AUD): A$3.34
- XRP Price (USD): $2.16
- 24h Change: ▼ 2.2%
- Market Cap: A$195.2 billion
- Fully Diluted Valuation: A$333.6 billion
- 24h Trading Volume: A$2.38 billion
- Circulating Supply: 58.5 billion XRP
- Max Supply: 100 billion XRP
Final Thoughts
XRP is hovering at a critical technical juncture. While bearish sentiment dominates the market, the current support levels have held up—for now. The next few days will be crucial in determining the token’s short-term direction. Traders and investors should keep an eye on the US$2.00 support line and whether XRP can muster enough volume to break above US$2.22 resistance.
In such a tightly wound market, the slightest shift in sentiment or volume could tip the scales significantly in either direction. Until then, caution remains the name of the game for XRP holders and traders alike.
Disclaimer
Last modified: May 16, 2025