
Meta Ends Wednesday in the Red
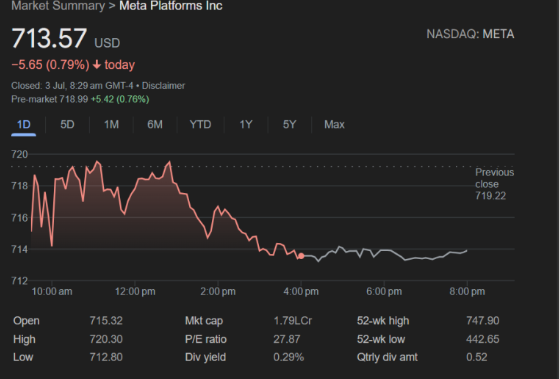
Meta Platforms Inc. (NASDAQ: META) stock closed lower in Wednesday’s session, drawing attention from traders ahead of the next open. The share price ended the day at $715.65, down 0.79% from the previous close of $719.22. Sellers dominated the session as the stock failed to hold its opening value. Meta opened at $715.32 and briefly climbed to an intraday high of $720.30 before falling. It reached a low of $712.80 and closed near that level, signalling a day-long downtrend.
Meta ends Wednesday in the Red
Chart Shows Decline Throughout the Session
Intraday movement showed an early attempt to climb higher, but consistent selling pressure weighed on the stock. By the end of the day, Meta had surrendered its early gains and settled near the session low. This price action indicates that market participants responded to broader caution, with no significant recovery before close.
Pre-Market Movement Hints at Rebound
Despite the down session, Thursday’s pre-market data suggests a potential shift. Meta traded higher at $720.42, a 0.76% rise over the previous close. The positive movement in pre-market trading may suggest renewed buying interest. If this strength continues at market open, it could help Meta recover the prior session’s losses. The early gains may allow the stock to test resistance levels near Wednesday’s high.
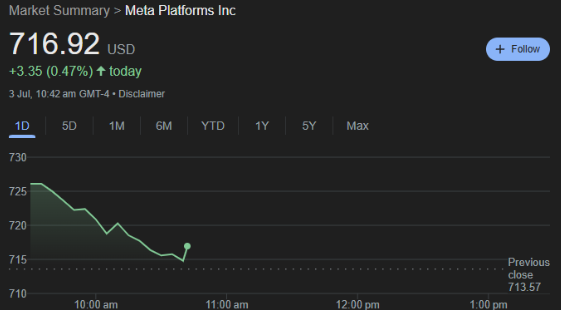
Meta hints at a rebound
Key Technical Levels for Monday’s Open
Traders are watching crucial levels heading into Monday’s open. The support level rests at $712.80, Wednesday’s low. Resistance is in the $719.22 to $720.30 range, formed during the previous session. A strong open above this range could confirm bullish sentiment. A fall below $712.80 could trigger continued selling. Short-term traders may focus on these points to determine momentum.
52-Week Range and Performance Context
Meta stock has experienced significant growth over the past year. It remains well above its 52-week low of $247.90. However, the share price currently trades about 5% below its peak, suggesting overhead resistance. This pullback may reflect recent market caution or profit-taking after a strong run. Traders should assess how the current price fits within broader trends before committing capital.
Valuation and Dividend Outlook
Meta’s Price-to-Earnings ratio stands at 27.87, reflecting investor expectations for future earnings growth. This figure places Meta in line with other major tech stocks in terms of valuation. The company also offers a dividend yield of 0.29%, paying $0.52 per share quarterly. While modest, this return adds income for long-term investors. The dividend provides some support for shareholders holding through market swings.
Market Capitalisation and Influence
Meta’s current market capitalisation sits at approximately $1.79 trillion. This valuation secures its position as one of the most significant companies globally. Its size ensures broad influence over the tech sector and market indices. Traders often monitor Meta’s moves as a signal for broader tech sentiment. Its performance can sway ETF balances, sector allocations, and algorithmic strategies.
Conflicting Signals Suggest Volatile Open
The latest trading activity presents mixed signals for investors. Wednesday’s sharp decline raises concerns about short-term weakness. However, the positive pre-market action offers a reason to remain cautious but alert. If the gains hold through the open, they may suggest a brief correction has passed. A sustained move above $720.30 would indicate strength. A drop below $712.80 would renew downside pressure.
Also Read: US Labour Market Surprises With Stronger June Jobs Report
Focus Points for Short-Term Traders
The first hour of trading on Monday will be critical for short-term decision-making. Traders should observe whether Meta holds pre-market gains. A strong open near or above $720.30 could invite fresh momentum buying. If the stock drops quickly below support, further selling may follow. The price action during early trade will provide clues about the stock’s short-term direction.
Strategic View for Market Participants
Traders planning to act on Meta’s stock should have clear entry and exit points. Volatility remains a risk given the mixed signals. Long-term holders may focus on fundamentals, while short-term traders will likely react to intraday movements. With resistance and support levels well defined, Meta’s next move could shape short-term sentiment in the tech sector.
Conclusion and Market Watch
It’s recent trading action reflects a tug-of-war between buyers and sellers. The pre-market bounce suggests optimism, but the prior decline warrants caution. Market participants should monitor opening momentum, price range activity, and volume levels. It’s direction on Monday may set the tone for broader tech performance across the week.