

National Australia Bank (ASX: NAB) released its 2026 Third Quarter Trading Update Supplementary Disclosures on 17 Aug 2026. It also discusses the Company’s home-lending performance, trends in asset quality and macroeconomic conditions over the next quarters affecting the Company.
Figure 1: A National Australia Bank branch sign against a clear sky [Courtesy: Shutterstock]
The document points to a resilient credit book even as mortgage applications pull back. For anyone tracking NAB profit strength 2026, the numbers suggest the Bank is managing a softer housing market without a meaningful deterioration in loan quality.
Home Lending Slows as NAB Navigates a Softer Market
NAB reported total home lending monthly applications fell 15 per cent in the third quarter against the second quarter of FY26. Applications were also down 16 per cent against the prior corresponding period.
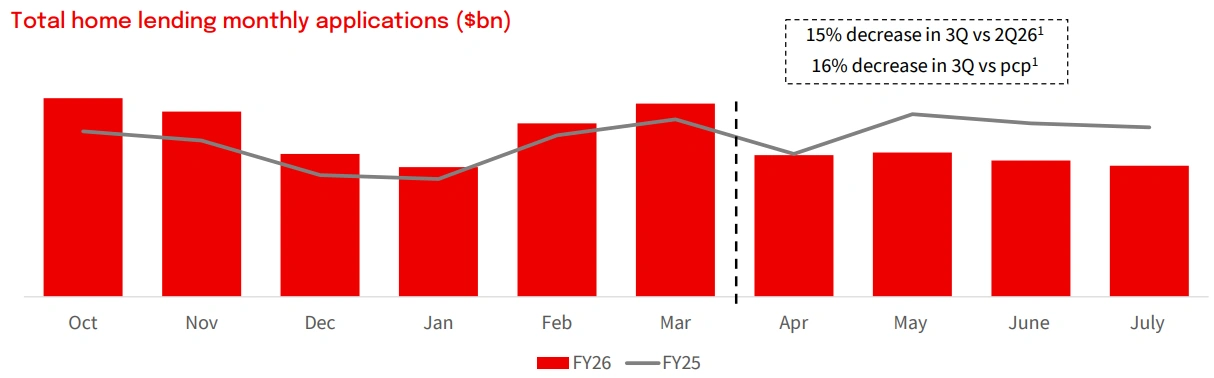
Figure 2: Monthly home lending application trends across FY25 and FY26 [Courtesy: National Australia Bank]
The slowdown hit both investor and owner-occupier segments. Investor lending applications dropped 17 per cent quarter on quarter, while owner-occupier applications declined 14 per cent. NAB Economics now forecasts total housing system credit growth of just 2.5 per cent in FY27, down from stronger levels in recent years.
Asset Quality Holds Steady Across the Group
NAB’s Group non-retail non-performing exposures sat at 1.91 per cent of gross loans and acceptances at Jun 2026, easing slightly from 1.99 per cent in Mar 2026. Watch loans, which flag early signs of stress, came in at 1.17 per cent of gross loans and acceptances for the same period.
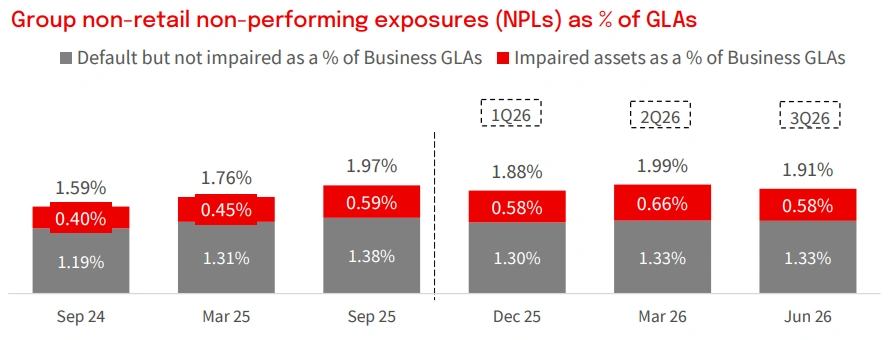
Figure 3: Group non-retail asset quality movement from Sep 2024 to Jun 2026 [Courtesy: National Australia Bank]
Group non-retail lending exposure at default stood at A$433.3 billion as at Jun 2026. Commercial property remains the largest single concentration in this book, followed closely by finance and insurance, and agriculture, forestry and fishing.
Business and Private Banking Lending Stays Resilient
Meanwhile, Business & Private Banking non-performing exposures eased to 2.91 per cent of gross loans and acceptances at Jun 2026 from 3.00 per cent in Mar 2026. Territory commercial property and non-retail lending to agriculture, forestry and fishing combined to account for close to half of this book.
Retail Portfolio Shows Limited Stress
NAB’s housing book shouldered the bulk of 90-plus days past due in Jun 2026 at 1.01 per cent of gross loans and acceptances. Overall dynamic loan-to-value increased 0.9 percentage points during the quarter to average 37.9 per cent.
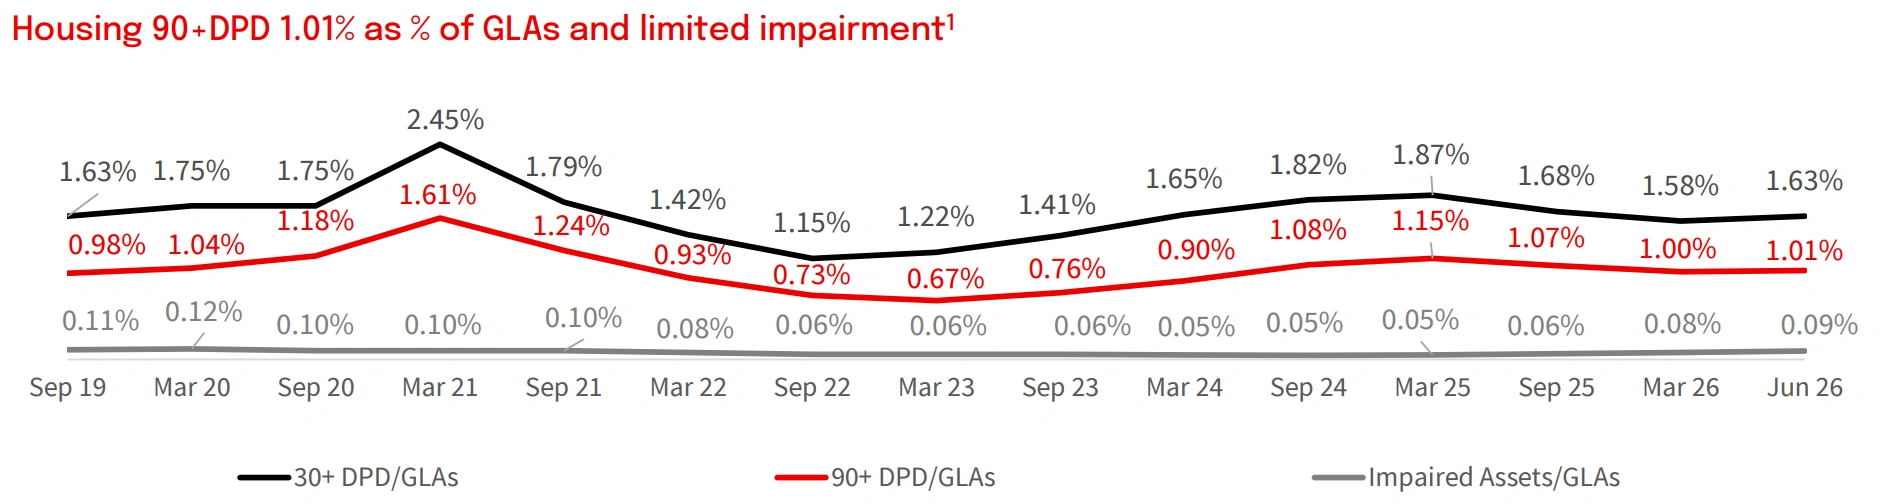
Figure 4: Housing arrears trend across NAB’s retail loan book to Jun 2026 [Courtesy: National Australia Bank]
Loans with a dynamic LVR above 90 per cent totalled A$9.4 billion. Of this, A$2.7 billion carried no lender’s mortgage insurance or first home buyer guarantee cover, with A$214 million sitting in 90-plus days past due or impaired status.
Economic Backdrop Shapes the Outlook
NAB Economics has tipped Australian GDP growth of 1.5 per cent this year, and reaching 1.9 per cent into CY27. The Unemployment rate is expected to creep slowly toward 4.8 per cent and the core Inflation should settle out around 2.7 per cent.
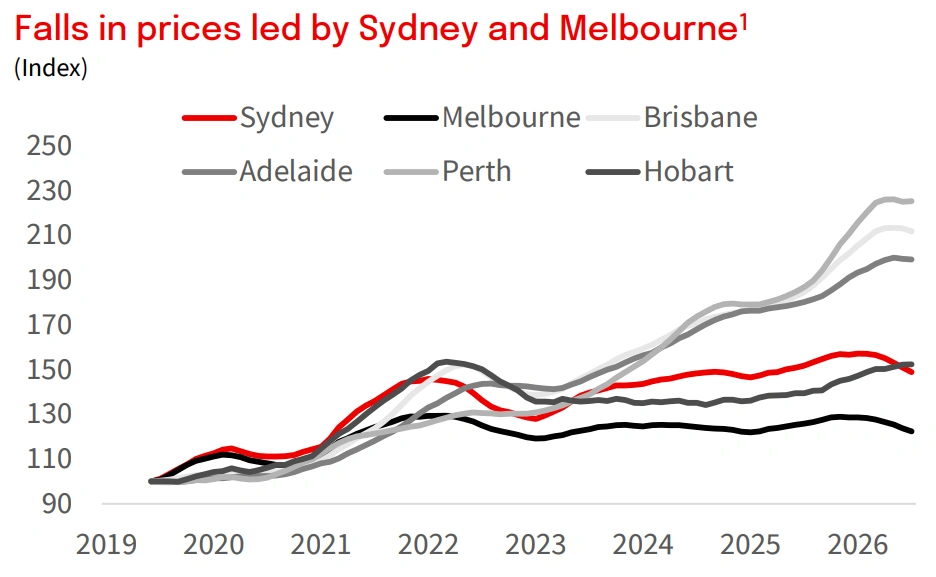
Figure 5: Capital city dwelling price movements to July 2026 [Courtesy: Cotality]
Australia and NZ Key Economic Indicators (%)
| Indicator | CY25 | CY26(f) | CY27(f) | Country |
|---|---|---|---|---|
| GDP growth | 2.5 | 1.5 | 1.9 | Australia |
| Unemployment | 4.3 | 4.6 | 4.8 | Australia |
| Trimmed-mean inflation | 3.3 | 3.4 | 2.7 | Australia |
| Cash rate target | 3.60 | 4.35 | 3.60 | Australia |
| GDP growth | 1.5 | 1.5 | 2.8 | NZ |
| Unemployment | 5.4 | 5.5 | 5.1 | NZ |
| Inflation | 3.1 | 3.8 | 1.8 | NZ |
| Cash rate (OCR) | 2.25 | 3.25 | 4.00 | NZ |
Sydney, Melbourne house prices drop; yet rents rise and across almost all capitals, tight vacancies. This mix of easing inflation and softer housing momentum forms the backdrop for the NAB Q3 results Australia banking narrative this quarter.
Business Confidence and Investment Conditions Soften
Business sentiment has also softened alongside the weaker lending picture, according to NAB Economics. Here is what stood out for the June 2026 quarter:
- Business confidence and business conditions have both eased from recent peaks
- Capacity utilisation has drifted below the long-run average of around 81 per cent
- Investment intentions, measured by capex expectations, sit below the historical average
- Purchase costs rose more sharply than labour costs and prices on a quarterly basis
- Labour cost growth has remained broadly steady near 2 per cent
- Price growth has stayed below both labour and purchase cost growth through 2026
This softer investment picture reinforces the theme of a bank managing a cooling economy while keeping credit quality intact.
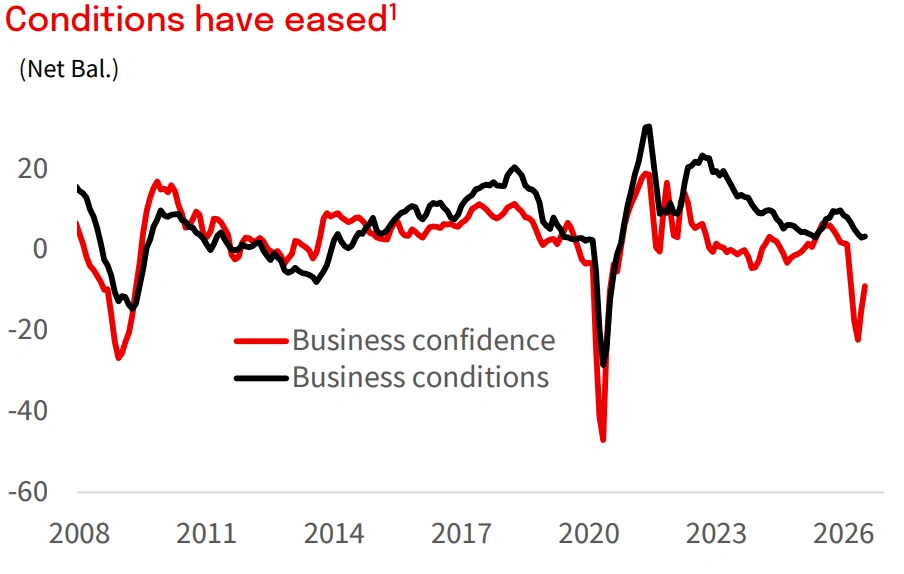
Figure 6: Business confidence and conditions trend to July 2026 [Courtesy: National Australia Bank]
NAB Share Price (ASX: NAB)
- Last traded price: A$39.37 per share
- Market capitalisation: A$128.96 billion
- 52-week range: A$35.48 to A$49.45 per share
- Update authorised for release by Inder Singh, Group Chief Financial Officer and Group Executive, Strategy
- Release date: 17 Aug 2026
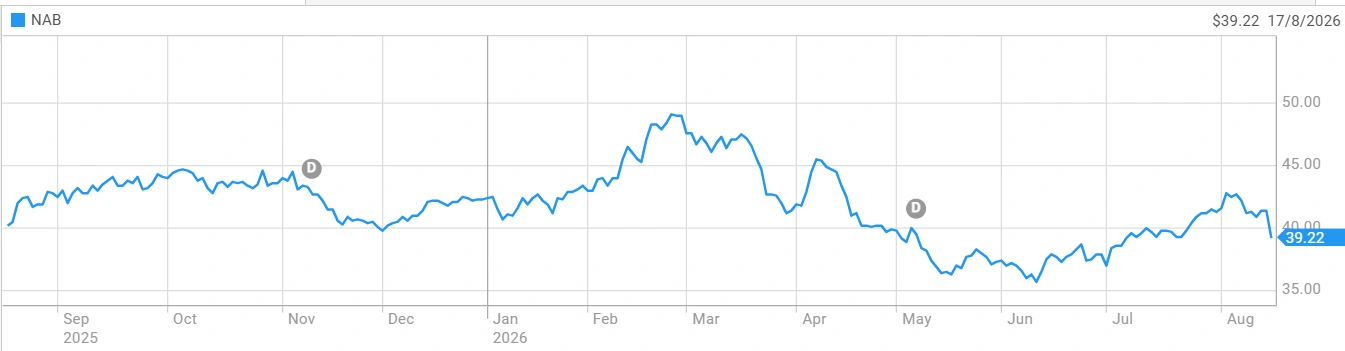
Figure 7: NAB share price movement over the past 12 months to 17 Aug 2026 [Courtesy: ASX]
Banking Sector Industry Outlook
For investors tracking the banking industry, NAB’s Q3 disclosures land against a backdrop of slowing credit growth across the banking sector. System-wide housing credit growth is forecast to ease to 2.5 per cent in FY27, down from 6.7 per cent expected in FY26.
Business lending remains the standout growth segment for the banking sector, forecast at 7.0 per cent system growth in FY27. This continues to offset softer conditions in housing and personal lending nationally.
Future Direction and Impact on NAB’s Lending Strategy
Completion of the current credit cycle will test whether NAB’s asset quality resilience holds as housing system credit growth slows further into FY27. According to the update, non-performing exposures have remained broadly range-bound despite the softer lending environment.
The Company’s exposure to commercial property and agriculture, forestry and fishing will likely remain the key watch points for the banking sector. Investors tracking NAB Q3 2026 update Australia data should also monitor how rate settings and unemployment forecasts evolve, given cash rate expectations are forecast to ease to 3.60 per cent by CY27.
NAB’s retail portfolio, particularly the A$9.4 billion in higher loan-to-value lending, may face pressure if house prices continue falling in Sydney and Melbourne. This impact on the Bank’s retail asset quality will be one of the more closely watched threads in coming quarters.
ALSO READ: St George Mining Lifts Araxá Measured and Indicated Resource by 155%
Challenger Gold Vs Traditional Gold Mines
Life360 Just Said Goodbye to Teammates. An AI Bet Is Why
FAQs
Q1. What did NAB report in its Q3 2026 trading update?
Ans. NAB said that its Group asset quality metrics are broadly steady, but reported a 15 per cent quarterly decline in applications for home loans.
Q2. Why does the NAB Q3 2026 update Australia matter to investors?
Ans. It shows how the Bank is managing softer housing demand while keeping non-performing exposures largely contained.
Q3. How is NAB’s business lending performing compared to housing?
Ans. Business lending remains the stronger growth segment, with system growth forecast well above housing for FY27.
Q4. What is happening with NAB’s watch loans?
Ans. Watch loans sit at 1.17 per cent of gross loans, a fairly steady read for the quarter.
Disclaimer
This article is meant only for informational purposes. If you are an investor who is watching National Australia Bank closely, all the data published in the content is sourced from ASX announcements and external sources. Kindly verify all the information related to the share price and market data. Any investment should be made at the investor’s own risk. Colitco does not hold any position in the above-mentioned company.
Source:
https://www.asx.com.au/markets/company/NAB

Luke Carlino is a seasoned Copywriter, Content Strategist, and Social Media Manager specialising in Mining, Finance, and Business journalism. With more than a decade of industry experience, he brings rigorous editorial standards and commercial acuity to every project.