
Zip Co Limited has delivered an exceptional full-year financial result for FY26. The Australian fintech powerhouse beat its own earnings guidance and posted record bottom-line numbers. Markets now view the company through a totally different lens than two years ago.
Investors seeking Zip Co FY26 investor insights Australia can see a clear operational shift. The company no longer pursues unprofitable transaction growth. Instead, it extracts massive operating leverage from its core markets.
The company is demonstrating true Zip Co rapid business scaling fintech prowess across both the Americas and Australasia. This deep dive explores the financial engines powering Zip into FY27 and beyond.
Record Profitability and Operating Leverage at Scale
Zip generated group total transaction volume (TTV) of $16.7 billion in FY26, up 27.2% year-on-year. Total group revenue expanded 24.6% to reach $1.35 billion. Disciplined execution drove group cash gross profit up 26.2% to $642.3 million.
Operating leverage served as the primary growth driver for the entire financial year. Group cash EBTDA jumped 57.9% to $268.9 million, easily outperforming initial corporate forecasts. Statutory net profit after tax surged 45.7% to $116.4 million.
Group operating margins expanded by 420 basis points to finish at a clean 20.0%. The management team maintained cash net transaction margins at 3.9%. Strong cost discipline across corporate teams converted top-line origination volume directly into cash.
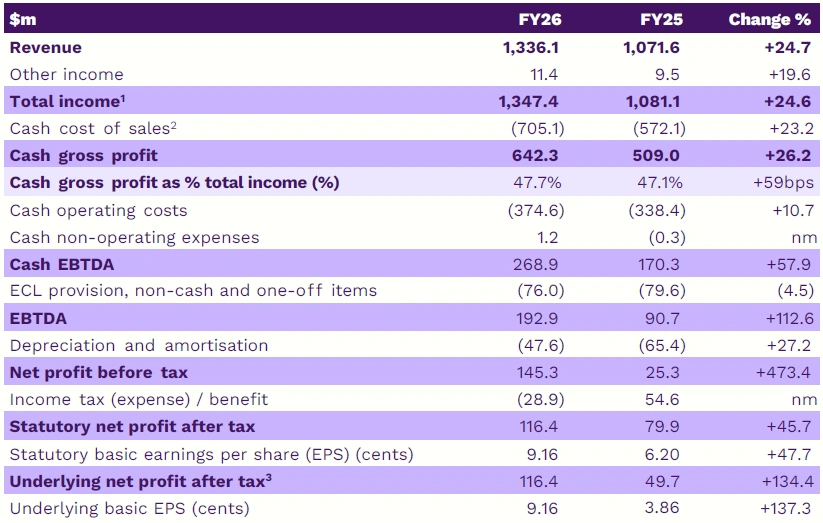
Fig 1: Income statement [Market index]
The American Growth Engine Outpaces Competitors
The United States represents the undisputed engine room of Zip’s global footprint. US transaction volume jumped 42.5% in local currency to US$8.6 billion. The American business now accounts for 76% of total group origination volume.
American customer numbers reached 4.6 million active users during the twelve-month cycle. US consumers transacted 13.1 times per year on average, up 23.1%. Average annual spend per American customer rose 30.5% to hit US$1,851.
US cash EBTDA leapt 51.4% to US$154.7 million as operating margins reached 25.0%. Merchant partnerships with Stripe and enterprise giants like Temu accelerated distribution. Physical card rollouts also pushed in-store volume up 67% year-on-year.
Credit Underwriting and Risk Control
Critics often argue that rapid credit growth leads to catastrophic bad debt losses. Zip dismantled that argument entirely with world-class machine learning models. The platform analyses 1.4 billion unique data points across 2,800 behavioural features.
US net bad debts settled at an enviable 1.73% of volume for the full year. Fourth-quarter US credit losses improved further to finish at just 1.67%. The US loan book recycles capital every seven weeks with an average order value of US$141.
More than 98% of all US transaction volume gets repaid in full without issue. Zip applies a disciplined “low and grow” credit limit policy to protect its balance sheet. The platform dynamically recalculates underwriting decisions on every single consumer checkout.

Fig 2: High growth business delivering record profitability at scale [Market index]
ANZ Delivers Exceptional Cash Flow Improvements
The Australian and New Zealand division engineered a dramatic turnaround throughout FY26. ANZ cash EBTDA doubled, surging 98.6% higher to hit $69.5 million. ANZ operating margins expanded by 753 basis points to 15.9%.
Active engagement offset modest customer growth across Australia. Local users transacted 27.3 times annually, spending an average of $2,123. The premium Zip Plus offering and new merchant partners like The Iconic powered this loyalty.
Australian receivables expanded 9.4% to reach $2.31 billion while maintaining a healthy 19.0% portfolio yield. Strategic refinancing reduced warehouse borrowing spreads across the domestic book. The company also initiated a clean wind-down of its sub-scale New Zealand operations.
AI-Native Infrastructure Powers Operational Efficiency
Zip transformed internal staff workflows by embedding artificial intelligence deep into daily infrastructure. Software engineers create 86% of US code and 57% of Australian code with AI tools. Automated underwriting systems streamlined merchant onboarding and customer collections.
Customer chatbots Zia in the United States and Zigi in Australia handle routine service inquiries. The business developed its custom ZedAI orchestration layer across twenty interconnected enterprise platforms. These automated workflows capped corporate cost growth despite booming top-line transaction volume.
Zip also collaborates directly with Google, Visa, and Stripe on emerging agentic commerce protocols. These partnerships position the company at the forefront of automated digital payments.
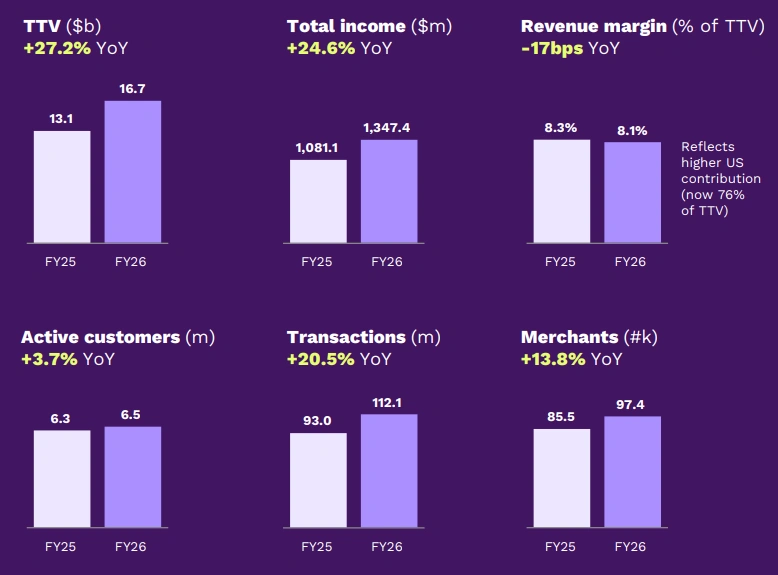
Fig 3: Significant top line growth underpinned by strengthened customer engagement and disciplined execution [Market index]
Capital Allocation and Corporate Strategy
A rigorous Zip Co investor analysis ASX 2026 highlights a highly proactive capital management approach. Zip generated robust operating cash inflows of $256.6 million across the financial year. Total available cash and liquidity stood at $246.5 million on 30 June 2026.
The Board completed $150 million in on-market share buybacks across two separate tranches. Management announced another on-market buyback programme of up to $50 million for FY27. Directors will also seek shareholder approval for a capital consolidation at the 2026 AGM.
Zip continues to evaluate a potential dual listing on a United States stock exchange. An American listing would align equity trading with Zip’s primary geographic revenue engine.
| Metric | FY27 Target Guidance |
|---|---|
| US TTV Growth (USD) | > 30.0% |
| Revenue Margin | Circa 8.0% |
| Cash NTM | 3.8% – 4.0% |
| Group Operating Margin | 20.0% – 22.0% |
| Group Cash EBTDA | > $340.0m |
Future Growth Catalysts for FY27
Management set confident guidance targets for the upcoming FY27 operating period. The company expects US transaction volumes to grow by at least 30% in USD terms. Group cash EBTDA guidance stands above $340 million.
Product development teams continue rolling out short-term liquidity tools like Pay-in-2 and Pay-in-8. The business also prepares to enter giant financial verticals like rent and bill payments. Early trials indicate that multi-product customers generate four times higher platform engagement.
Zip enters FY27 with substantial funding headroom, lower debt costs, and record cash generation. The company has evolved from a simple installment lender into an agile digital challenger. Institutional equity investors on the ASX now possess clear proof of a scalable business model.
Also read: Develop Global Unlocks $275M Yitirrti Deal to Accelerate Multi-Mine Growth Strategy
FAQs
Q: Did Zip Co beat its full-year FY26 earnings guidance?
A: Yes, group Cash EBTDA reached $268.9m (up 57.9% YoY), surpassing guidance of at least $260.0m.
Q: What is the primary engine powering Zip’s revenue and transaction scaling?
A: The US market drove momentum with TTV up 42.5% in USD to US$8.6b, now generating 76% of total group volume.
Q: How well is Zip managing credit risk and net bad debt losses?
A: US net bad debts finished at 1.73% of TTV for FY26 (improving to 1.67% in 4Q26), holding securely inside the 1.5%–2.0% target range.
Q: What are Zip’s key capital management and listing plans for FY27?
A: Management announced an on-market share buyback of up to $50m while actively evaluating a potential dual listing on a US stock exchange.
Also read: Top ASX Rare Earth Stocks 2026 That’re Turning Into Real Returns for Australians
Disclaimer
This article is meant only for informational purposes. If you are an investor who is watching Mineral Resources Limited closely, all the data published in the content is sourced from ASX announcements and external sources. Kindly verify all information related to the share price and market data. Any investment should be made at the investor’s own risk. Colitco does not hold any position in the above-mentioned Company
Sources:

Elizabeth Jones is a finance and mining content specialist with over 10 years of experience creating clear, SEO-driven content across fintech, investing, banking, insurance, cryptocurrency, and resource markets. She transforms complex financial data and industry trends into engaging, reader-focused articles that improve understanding and audience engagement.