
The Evolution Mining FY26 results show statutory profit after tax of A$1.48 billion, up 59% from the previous year. Revenue reached A$5.56 billion.
Gold production went the other way, falling 5% to 714,728 ounces in the year ended 30 June 2026. Copper output also declined.
Those figures leave two questions for shareholders. How much of the improvement came from metal prices? And which operations made progress that could hold up under less favourable prices?
All financial figures below are in Australian dollars unless stated otherwise.
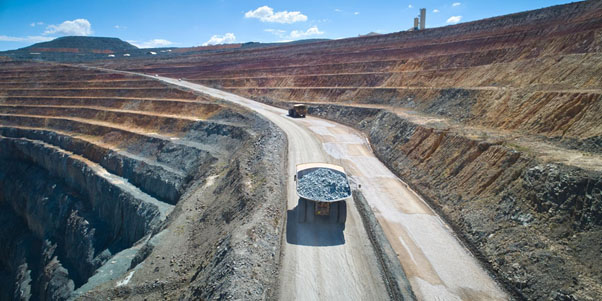
Figure 1: Cowal gold operation in New South Wales. File image. Credit: Evolution Mining.
Higher Gold Prices More Than Covered the Cost Increase
Evolution received an average A$6,023 for each gold ounce sold, compared with A$4,300 in FY25. That was a 40% increase.
| Measure | FY25 | FY26 |
| Gold production | 750,512oz | 714,728oz |
| Copper production | 76,261 tonnes | 65,636 tonnes |
| Average realised gold price | A$4,300/oz | A$6,023/oz |
| AISC | A$1,572/oz | A$1,717/oz |
| Revenue | A$4.35 billion | A$5.56 billion |
| Underlying EBITDA margin | 51% | 57% |
| Statutory profit after tax | A$926.2 million | A$1.48 billion |
The cost comparison needs one qualification. Evolution excludes Mt Rawdon from its headline AISC figures and has restated FY25 on the same basis. Group gold production includes the operation.
The 57% Margin Is Not the Final Profit Margin
A reader looking at the Evolution Mining profit margin needs to check which measure is being used.
Dividing statutory profit after tax by revenue gives a net profit margin of approximately 26.5%. The same calculation for FY25 gives about 21.3%.
Both improved. They describe different stages of the accounts.
AISC serves another purpose: it helps assess the cost of sustaining mining operations. Subtracting AISC from the gold price does not establish the profit available to shareholders. Growth spending, financing, tax and other accounting items still need to be considered.
Evolution identifies AISC and its underlying earnings measures as non-IFRS information.
Higher Revenue Also Brought Higher Expenses
The rise in Evolution Mining gold production costs had several causes.
Higher metal prices increased price-linked royalties. Inflation, maintenance consumables and fuel added pressure. Third-party ore testing at Mungari also contributed to costs.
Cost of sales, excluding depreciation and amortisation, increased by approximately A$238 million.
There were operating interruptions too. Severe weather affected Ernest Henry in late December 2025, and underground production was suspended. Full commercial production resumed on 1 April 2026.
Evolution recorded A$45.4 million in non-operational costs for flood recovery and equipment replacement at the operation.
Strong prices helped the group absorb these expenses. The annual result should therefore be read alongside the work required to keep individual mines running reliably.
Mungari Produced More Gold at a Lower Cost
Mungari provides a clearer example of an operating improvement.
The mine’s net cash flow reached A$366.5 million, compared with an outflow of A$157.8 million in FY25.
| Mungari measure | FY25 | FY26 |
| Gold production | 134,984oz | 186,115oz |
| AISC | A$2,753/oz | A$2,249/oz |
| Net mine cash flow | –A$157.8 million | A$366.5 million |
The processing expansion was completed at a reported project cost of A$212 million, below the A$250 million budget. Major capital expenditure also fell from the previous year.
Mungari consequently benefited from higher gold prices, more production and reduced expansion spending. That combination explains more than a gold-price chart alone could.
For another look at the relationship between mine activity and costs, Colitco’s Bellevue Gold production coverage examines the work behind an annual output target.
Red Lake Shows How Much Prices Can Change Cash Flow
Red Lake tells a different story. Yet net mine cash flow rose to A$286.1 million from A$73.7 million.
That improvement came without a production increase or a reduction in reported unit costs. Higher gold prices were an important part of the result.
The distinction matters when assessing the following year. Mungari had more ounces and lower unit costs behind its performance. Red Lake’s cash improvement depended more heavily on the revenue earned from broadly similar production.
Copper Makes the Group Cost Figure Harder to Compare
Evolution also produced 65,636 tonnes of copper. Its average realised copper price increased 25% to A$18,051 a tonne.
At Northparkes, the reported AISC was negative A$8,314 per gold ounce. Evolution attributed the result to favourable metal prices and a higher copper-to-gold production mix.
That negative figure should not be interpreted as an operation without expenses. It shows why a cost measure expressed per gold ounce needs care at a mine with substantial copper revenue.
Comparisons with other gold producers should account for their metal mix, reporting definitions and capital requirements. Colitco’s Regis Resources growth outlook offers another company’s production and development context.
More Cash Remained After Mine Spending
Evolution’s net mine cash flow more than doubled to A$2.08 billion.
That measure follows deductions for sustaining capital, major capital and non-operational cash costs. It is useful evidence that the stronger mining result survived substantial spending.
Sustaining and major capital together totalled approximately A$1.09 billion, broadly unchanged from FY25.
Separately, the statutory cash flow statement recorded A$2.64 billion in operating cash inflows. Year-end cash reached A$1.35 billion, compared with A$759.5 million a year earlier.
Total dividends declared for FY26 were 41 cents a share, up 105%. This is a different measure from dividends actually paid during the financial year.
The Next Check Is Whether Operating Gains Continue
FY26 left Evolution with stronger profits and more cash. Higher realised prices did much of the work, while Mungari contributed a measurable improvement in production and costs.
The next reports need to show whether those operating gains continue. Investors can watch Mungari’s output, Ernest Henry’s operating continuity and the spending required across the portfolio.
Evolution had no remaining gold or copper hedges at 30 June 2026. The useful test is how production, costs and cash move together when those prices change.
ALSO READ: Evolution Mining’s Gold Margins Hold Despite Slow Start
FAQs
Q1. What was the gold production of Evolution Mining in FY26?
Ans. Evolution produced 714,728 ounces, a decrease of 5% from 750,512 ounces in FY25.
Q2. Why did profit rise despite lower production?
Ans. Higher realised gold and copper prices increased revenue. Gold’s average realised price rose 40%, considerably faster than AISC.
Q3. What were Evolution’s FY26 production costs?
Ans. Group AISC was A$1,717 per ounce, excluding Mt Rawdon. The comparable FY25 figure was A$1,572.
Q4. What was Evolution’s net profit margin?
Ans. Statutory profit divided by revenue gives approximately 26.5%. The separately reported underlying EBITDA margin was 57%.
Disclaimer
This article provides information, not financial advice. FY26 figures, not predictions. Commodity prices, operational circumstances, and project expenditure may impact performance. Investments risk loss.

Luke Carlino is a seasoned Copywriter, Content Strategist, and Social Media Manager specialising in Mining, Finance, and Business journalism. With more than a decade of industry experience, he brings rigorous editorial standards and commercial acuity to every project.