

The Australian stock exchange sends a good message to long-term investors. The smart investors infrequently look at Telstra Group Ltd (ASX: TLS) and National Australia Bank Ltd (ASX: NAB). They both belong to blue-chip investment class but are involved in the different kinds of economic activities.
According to institutional desks, portfolio adjustment is constantly required to deal with the uncertainty of macroeconomics. Investors want to have stable cash flows and profits in the face of contradictory economic reports.
The current market environment makes this asset choice urgent. We are seeing a distinct ASX capital rotation that separates pure defensive infrastructure from rate-sensitive financial institutions. Capital flows reward operational certainty above all else.
This detailed comparative analysis examines how Telstra telecom resilience stacks up against NAB banking cycle exposure. The latest fundamental metrics and share price data reveal which stock offers the superior risk-adjusted opportunity right now.
Understanding the ASX Capital Rotation
The Australian share market frequently undergoes structural capital rotation when monetary policy uncertainty clouds the economic horizon. Fund managers actively reallocate capital from cyclical industries toward non-discretionary businesses with stable demand profiles.
This active ASX capital rotation reflects a calculated pivot toward earnings security. When consumer discretionary budgets tighten, institutional investors shed vulnerability and purchase essential services. Telecom providers hold a commanding advantage in this specific climate.

Fig 1: Telstra Group Limited Overview [au.finance.yahoo.com]
Everyday consumers cut discretionary dining, retail purchases, and luxury travel before they disconnect their home broadband or mobile phones. Telecommunications access functions as a non-negotiable household utility in modern Australia.
Commercial lending tells a much more fragile story during economic shifts. Businesses delay credit expansion, debt service costs escalate, and commercial loan pipelines inevitably slow down. Equity markets price this disparity into share valuations very quickly.
Telstra Telecom Resilience Drives Defensive Value
Telstra anchors the nation’s digital connectivity across metropolitan centres and regional territories alike. Beyond its domestic dominance, the company operates across twenty overseas jurisdictions, providing mission-critical communications infrastructure to enterprise clients.
The group’s 2022 corporate reorganisation established four clear operating pillars: ServeCo, InfraCo Fixed, Amplitel, and Telstra International. This clean divisional architecture unlocks operational efficiency and protects valuable telecommunications assets.
The core strength behind Telstra telecom resilience lies in its unyielding recurring cash flows. Millions of retail subscribers and enterprise customers pay predictable monthly bills, insulating the top line from macroeconomic downturns.
Telstra supports a solid market capitalisation of $54.36 billion on the ASX. The business generates an earnings per share of $0.199, funding a dependable annual dividend per share of $0.21.
Income investors enjoy an attractive dividend yield of 4.34%. Telstra backs this yield with franking credits sitting slightly above 90.48%, delivering reliable tax offsets alongside defensive capital protection.
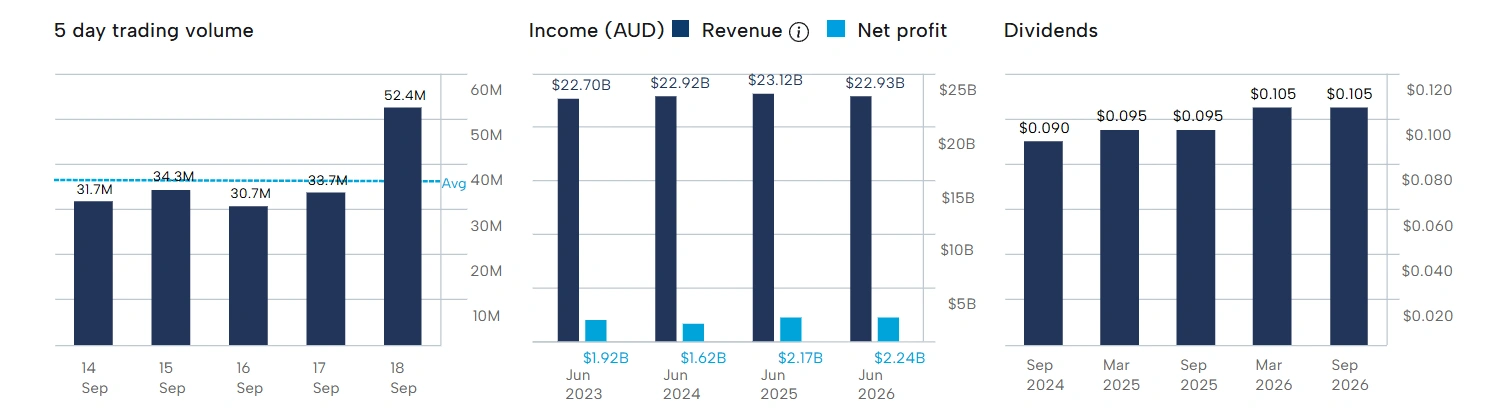
Fig 2: Telstra Group Limited Overview [asx.com.au]
NAB Banking Cycle Exposure Creates Valuation Friction
National Australia Bank commands an immense presence across the domestic economy with a market capitalisation of $118.53 billion. The institution drives retail mortgages, corporate banking, commercial credit, and wealth management services across Australia and New Zealand.
Despite its impressive financial footprint, NAB banking cycle exposure introduces material headwinds in the current market. Bank earnings remain closely tied to borrower solvency, interest rate trajectories, and property market momentum.
Lenders must navigate persistent net interest margin compression and potential increases in bad debt provisions. Stricter borrowing limits and elevated debt servicing costs continue to dampen wholesale credit demand across key commercial sectors.
NAB still produces robust absolute accounting profitability. The bank delivers a strong earnings per share of $2.00, supporting a substantial dividend per share of $1.70.
That distribution equates to an appealing 4.45% dividend yield with 100% full franking. However, broader credit cycle risks continue to cap price appreciation and inject volatility into the bank’s trading performance.
Valuation Metrics and Balance Sheet Reality
A quick glance at traditional valuation multiples might lead casual observers to assume NAB offers the better bargain. NAB trades at a price-to-earnings (P/E) ratio of 19.11, while Telstra trades on a higher multiple of 24.32.
Lower earnings multiples often reflect heightened operating risks rather than underpriced value. The equity market places a justified premium on Telstra’s non-discretionary subscription revenues, which face virtually no credit default risk.
Telstra transforms its vast network assets into steady, contracted operational income month after month. NAB, conversely, must maintain extensive capital buffers to absorb potential loan defaults and fluctuating wholesale funding costs.
Income investors must balance NAB’s slightly superior yield against the threat of capital loss. Full franking credits cannot compensate a shareholder if broader banking pressures steadily erode the underlying share price.
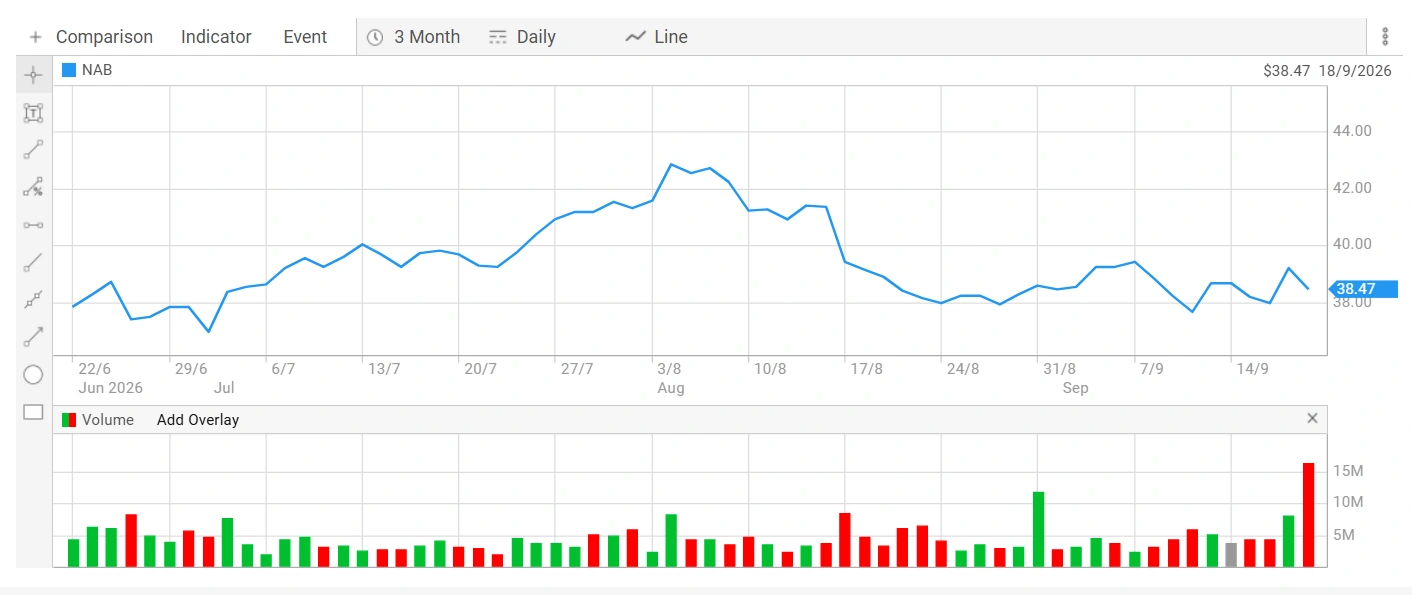
Fig 3: NAB Share price chart [asx.com.au]
Stock Price Trends Indicate a Change in Investment Preferences
The latest trading activity shows a contrasting trend in the performance of these two companies. Telstra achieved a modest but positive 3.70% return on investment in the year 2026, indicating a decent performance compared to the whole index.
Australian NAB, on the other hand, suffered a decline of 7.66% during the same timeline, making it clear that the experts in financial institutions have started shifting their focus from stock in commercial banks to telecommunications infrastructure.
The movement of stock prices over the first week of September 2026 is another evidence of the change taking place. The shares of Telstra went from $4.63 to $4.88 giving about 5.4% return.
NAB stocks dropped over the same week from $38.50 to $38.02. The NAB stocks were very volatile and sold aggressively, unlike Telstra stocks that experienced moderate buy demand and very low volatility.
The Strategic Verdict: Which Blue Chip Wins Today?
Selecting the superior investment requires assessing the total return profile rather than looking at headline yields in isolation. Telstra offers a markedly cleaner outlook in the current market environment.
NAB remains a high-quality financial institution with an attractive, fully franked income stream. Yet its ongoing cyclical exposure exposes investors to margin compression and broader macroeconomic turbulence.
Telstra pairs dependable utility revenue with proven share price momentum and robust structural protection. The defensive telecom leader stands out as the smarter, more stable allocation for Aussie portfolios today.
Also read: Build an ASX Portfolio Strategy for Market Selloffs
FAQ
Q: Why are investors rotating capital into Telstra instead of NAB?
A: Smart money is actively swapping rate-sensitive financial stocks for Telstra’s recession-proof telecom revenue.
Q: Does NAB’s higher dividend justify the banking cycle risk?
A: NAB offers a larger fully franked yield, but banking margin pressures wipe out those income gains through steady capital declines.
Q: Which of these ASX blue chips shows stronger 2026 price momentum?
A: Telstra clearly leads the pack with positive year-to-date growth, while NAB drags portfolios down with a negative 7.66% return.
Q: How does Telstra provide defensive cover in a volatile economy?
A: Telstra protects your capital because Aussie households and businesses treat mobile and broadband access as an absolute, non-negotiable daily utility.
Disclaimer
This article is meant only for informational purposes. If you are an investor who is watching Mineral Resources Limited closely, all the data published in the content is sourced from ASX announcements and external sources. Kindly verify all information related to the share price and market data. Any investment should be made at the investor’s own risk. Colitco does not hold any position in the above-mentioned Company
Source
https://www.fool.com.au/2026/09/18/telstra-vs-nab-which-asx-blue-chip-is-the-better-buy/

Luke Carlino is a seasoned Copywriter, Content Strategist, and Social Media Manager specialising in Mining, Finance, and Business journalism. With more than a decade of industry experience, he brings rigorous editorial standards and commercial acuity to every project.