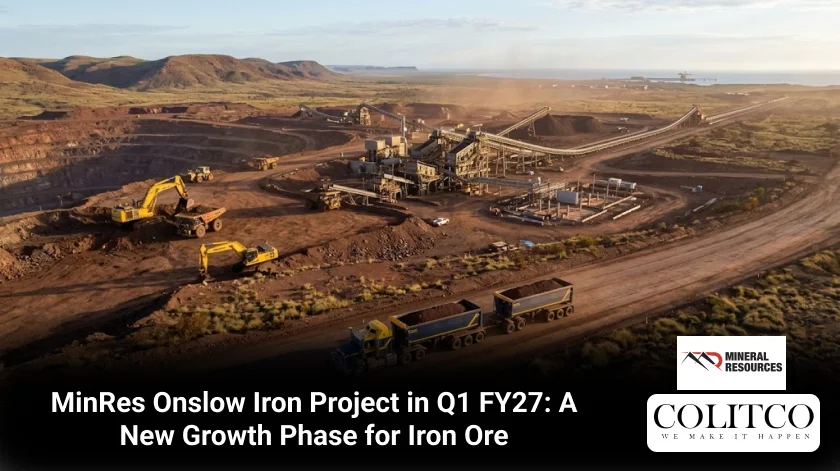
Mineral Resources Limited (ASX: MIN) put out its first-quarter FY27 update on 23 October. The Quarterly Activity Report covers July to September 2026. Guidance didn’t move in any division. Iron ore grabbed most of the attention, and the MinRes Onslow Iron project sits right at the centre of it. Lithium, debt and credit ratings all nudged in the right direction too.
What the MinRes Onslow Iron Project Delivered in Q1 FY27
Onslow Iron shipped 9.2Mt on a 100% basis over the quarter. September was the best month yet, with exports of 3.49M wmt (100%). Attributable shipped volumes came to 5.0M wmt. Full-year guidance is 20.0-21.7M wmt, so the start looks healthy.
Costs helped as well. FOB cost landed at $53/wmt, below the FY27 guidance range of $54-$58/wmt. When iron ore prices wobble, a lower cost base matters a lot. One good quarter doesn’t make a trend, though. The next few updates will show whether it sticks.
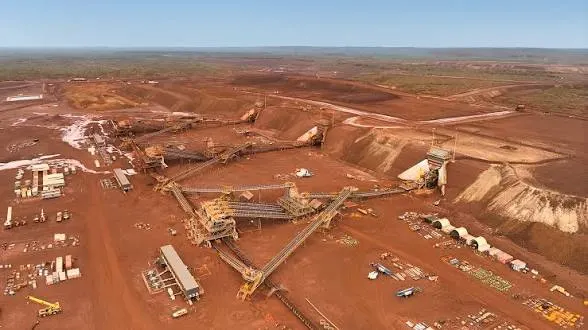
Onslow Iron exports reached a record 3.49M wmt (100%) in September 2026. [Mineral Resources]
Why Mineral Resources Iron Ore Production Is Picking Up Pace
Scale is part of the answer. Mining Services produced a record 103Mt, up 10% on the previous quarter. Guidance for the division is 370 – 390Mt this year. That contracting work feeds the wider group, so a big quarter there flows through.
Mineral Resources iron ore production now carries more weight in the group. Onslow Iron is ramping up while the Pilbara Hub keeps humming beside it. Both assets give MinRes more say over its costs and shipping schedule. If volumes rise and unit costs stay low, margins should follow. That’s the bet behind this growth phase.
Image caption: Record Mining Services production of 103Mt supported group volumes in Q1 FY27.
Where the Pilbara Hub and Lithium Fit In
Iron ore isn’t the whole picture. Lithium had a busy quarter, and the Pilbara Hub stayed on track. Here’s how the main assets compared with FY27 guidance:
- Pilbara Hub: Produced 3.2M wmt and shipped 2.9Mt, with Lamb Creek now fully operational. FOB cost was $75/wmt, inside the $74-$79/wmt range.
- Wodgina: Sold 90k dmt SC6 at $674/dmt SC6, inside the $640-$710/dmt SC6 range.
- Mt Marion: Sold 58k dmt SC6 at $1,029/dmt SC6, just above the $960-$1,020/dmt SC6 range. MinRes calls this a transitional year, with flotation plant construction progressing strongly.
- Bald Hill: Sold 21k dmt SC6 at $1,498/dmt SC6, well above the $1,150-$1,250/dmt SC6 range.
- Group lithium: Record attributable sales of 170k dmt SC6, up 8% on the previous quarter.
When Debt Fell and Credit Strengthened
The balance sheet looked better by the end of September. MinRes trimmed net debt while still funding capex and paying a dividend. A few other milestones landed in the same period:
- Net debt: Down $0.2B to approximately $4.1B.
- Liquidity: Up $0.1B to $2.5B, after capex of $0.3B and an FY26 dividend payment of $0.2B.
- Credit rating: Fitch upgraded MinRes to BB, with a stable outlook.
- Regulatory matters: ASIC concluded its investigation with no enforcement action.
How the Mineral Resources FY27 Outlook Looks
Management kept every guidance range unchanged. After a strong first quarter, that reads as confidence rather than caution. The Mineral Resources FY27 outlook rests on these targets:
- Onslow Iron:0-21.7M wmt at an FOB cost of $54-$58/wmt.
- Pilbara Hub:0-11.0M wmt at an FOB cost of $74-$79/wmt.
- Mining Services: 370 – 390Mt of production.
- Capex: $1,425M for the year, with $310M spent in Q1.
MinRes also held a results call at 8:00am AWST on 23 October 2026. Investors can register here. A transcript will appear on the company website. Anyone weighing the full-year numbers should find it useful.
Also Read: Zip Co Share Price Drops as US Fraud Dents Growth
FAQs
Q1: How much iron ore did Onslow Iron ship in Q1 FY27?
A1: Onslow Iron shipped 9.2Mt on a 100% basis. Attributable shipped volumes were 5.0M wmt.
Q2: What was the Onslow Iron FOB cost?
A2: FOB cost was $53/wmt in the quarter. That beat FY27 guidance of $54-$58/wmt.
Q3: How much did MinRes reduce net debt?
A3: Net debt fell $0.2B to approximately $4.1B. Liquidity rose $0.1B to $2.5B.
Q4: Did MinRes change its FY27 guidance?
A4: No, guidance was maintained across all divisions. Onslow Iron remains at 20.0-21.7M wmt for the year.
Disclaimer:
This article sums up MinRes’ Q1 FY27 quarterly activity report, released on 23 October 2026. It’s general information only, not financial advice. All figures and guidance ranges come from the company, and they can change. Mining output, commodity prices and costs all carry risk. Please check the original ASX announcement and speak with a licensed adviser before you invest.

Elizabeth Jones is a finance and mining content specialist with over 10 years of experience creating clear, SEO-driven content across fintech, investing, banking, insurance, cryptocurrency, and resource markets. She transforms complex financial data and industry trends into engaging, reader-focused articles that improve understanding and audience engagement.