Walk into any bullion dealer in Sydney or Melbourne, and you will notice something curious on the price board: gold and silver almost always rise and fall in tandem. It is not a coincidence. The two metals are bound together by a web of economic forces, historical precedent, and investor psychology that makes their relationship one of the most reliable correlations in global commodity markets.
So why do these two precious metals move in lockstep, and what does it mean for everyday Australians looking to protect their savings?
A Shared Monetary Heritage
Gold and silver have functioned as money for thousands of years. For much of modern history, national currencies were formally pegged to one or both metals under bimetallic or gold-standard systems. Although those days are long gone, the psychological imprint remains. Investors still treat both metals as stores of value and as hedges against inflation, currency debasement, and geopolitical uncertainty.
When the US dollar weakens, as it often does during periods of loose monetary policy, both gold and silver become cheaper for buyers holding other currencies, including the Australian dollar. Demand rises across the board, lifting both metals simultaneously. The reverse is equally true: a strong greenback tends to drag both prices lower.
The Safe-Haven Effect
During times of economic stress, investors flee to perceived safe havens. Gold is the more famous refuge, but silver is carried along in its slipstream. When financial markets wobbled during the COVID-19 pandemic, and again during the banking sector turbulence of 2023, both metals surged as nervous investors sought shelter from volatility.
The safe-haven dynamic is self-reinforcing. As gold rallies, media coverage intensifies and retail investors, many of them new to precious metals, pile into silver as a more affordable alternative. This rush of fresh capital pushes silver prices higher, tightening its correlation with gold even further.
Industrial Demand Adds a Twist
Unlike gold, silver has significant industrial applications. It is a critical component in solar panels, electric vehicle components, medical devices, and electronics. This industrial demand gives silver its own independent price drivers, which occasionally causes the two metals to diverge, particularly when global manufacturing activity is booming or contracting sharply.
However, over longer time horizons, the monetary and safe-haven factors tend to dominate. Analysts commonly track the gold-to-silver ratio, the number of ounces of silver required to buy one ounce of gold, as a measure of relative value. Historically, this ratio has averaged somewhere between 50 and 80, and traders use extreme deviations as potential buy or sell signals for one metal relative to the other.
What Drives Both at Once
Several broad macroeconomic forces move gold and silver in the same direction at the same time. Real interest rates are perhaps the most powerful. When central banks such as the Reserve Bank of Australia or the US Federal Reserve cut rates or signal a looser monetary stance, the opportunity cost of holding non-yielding assets like precious metals falls, making both more attractive. Conversely, aggressive rate hikes, as seen globally between 2022 and 2024, tend to weigh on both metals simultaneously.
Inflation expectations, geopolitical tension, and shifts in currency markets all exert similar parallel pressures, reinforcing the tendency for gold and silver to travel together.
The Bottom Line for Australian Investors
For those weighing up precious metals as part of a diversified portfolio, understanding the gold-silver relationship matters. While silver is typically more volatile and offers greater upside during bull markets, both metals respond to the same fundamental forces. Buying one without understanding the other is a bit like following the cricket without knowing the rules; you will catch the highlights but miss what is really going on.
Gold and Silver Price Now
The charts tell a remarkable story. As of today, gold is trading at US$4,985.77 per ounce, just a whisker below the psychologically significant US$5,000 mark, after gaining an extraordinary 69.63 per cent over the past twelve months. Silver, sitting at US$78.18 per ounce, has been even more impressive over the same period, surging 135.09 per cent. Both charts show near-vertical climbs through the back half of 2025, a move that has left many seasoned analysts rubbing their eyes.
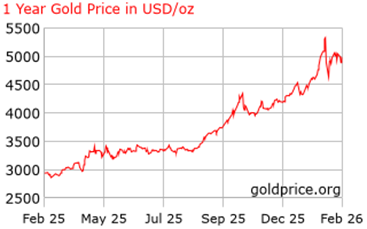
Figure 1: Gold price hike in the last 1 year [Goldprice]
The six-month figures are particularly striking: gold is up 49 per cent and silver has more than doubled, rising 105 per cent in that window alone. These are not the gentle, grinding gains associated with traditional safe-haven accumulation. They suggest something more urgent, a broad repricing of monetary assets driven by persistent inflation concerns, sovereign debt anxiety across major economies, and what appears to be a significant increase in central bank buying, particularly from institutions in Asia and the Middle East seeking to reduce US dollar exposure.
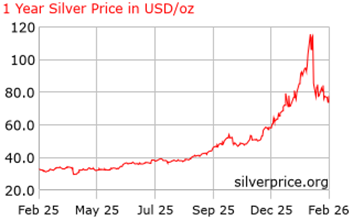
Figure 2: Silver price performance in the last 1 year [Goldprice]
The gold-to-silver ratio currently sits at approximately 63.8, meaning it takes roughly 64 ounces of silver to buy one ounce of gold. Historically, this ratio has compressed sharply during the later stages of precious metals bull markets, as silver tends to play catch-up and then overshoot. Silver’s recent 30-day pullback of 16.36 per cent, compared to gold’s modest 3.17 per cent gain over the same period, highlights just how volatile silver can be, and may represent a consolidation rather than a trend reversal.


