The CBA capital adequacy ratio measures how much eligible capital the bank holds against the risks on its books. The AUD 108.9 billion in the headline is the total amount that qualified at 30 September 2026. Only part of it was common equity, and a smaller portion again stood above the bank’s reported requirements. CBA’s quarterly disclosure, released on 11 November, shows where those distinctions matter.
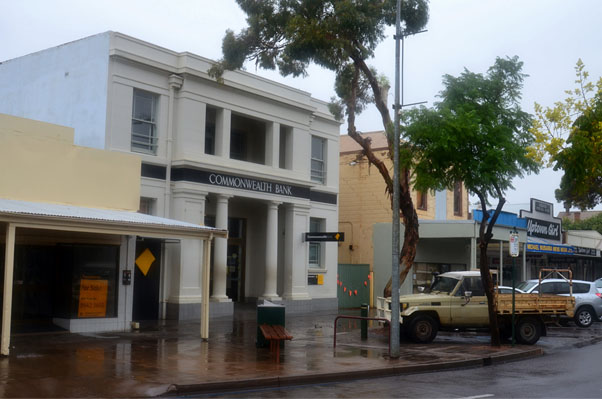
Figure 1: Commonwealth Bank in Port Augusta, South Australia, photographed on 20 April 2017. Archive photograph. Credit: Bahnfrend, Wikimedia Commons.
Tier 2 Capital Rose Almost Dollar for Dollar as Common Equity Fell
The AUD 44 million increase in total capital hides two much larger movements. Common Equity Tier 1 (CET1), the bank’s highest-quality loss-absorbing capital, fell by AUD 1.540 billion. Tier 2 capital rose by AUD 1.584 billion. Additional Tier 1 capital did not change.
| Group capital measure | 30 June 2026 | 30 September 2026 | Change |
| Common Equity Tier 1 capital | AUD 62.762bn | AUD 61.222bn | −AUD 1.540bn |
| Additional Tier 1 capital | AUD 7.907bn | AUD 7.907bn | Unchanged |
| Tier 2 capital | AUD 38.159bn | AUD 39.743bn | +AUD 1.584bn |
| Total regulatory capital | AUD 108.828bn | AUD 108.872bn | +AUD 44m |
| Risk-weighted assets | AUD 522.407bn | AUD 531.411bn | +AUD 9.004bn |
| CET1 ratio | 12.0% | 11.5% | −0.5 percentage points |
| Total capital ratio | 20.8% | 20.5% | −0.3 percentage points |
Figures cover CBA’s Level 2 consolidated banking group. Ratios are shown as reported, rounded to one decimal place.
During the quarter, CBA issued qualifying subordinated notes in pounds sterling, Singapore dollars, US dollars and offshore renminbi. It also redeemed notes denominated in Australian dollars and Japanese yen. Eligible subordinated notes count towards Tier 2 capital. They do not replenish common equity. That is why the near-flat total tells a different story from the CET1 figure shareholders tend to follow.
The Final Dividend Outweighed Capital Generated From Earnings
The Commonwealth Bank CET1 ratio ended September at 11.5%. To understand the move from June’s 12.0%, it helps to read the quarter in two parts. Before the effect of the final dividend, the bank gained 36 basis points. The dividend then took off 85 basis points. One basis point is one-hundredth of a percentage point.
CBA broke down the movement as follows:
- Earnings added 52 basis points. Profit generated during the quarter added to common equity capital.
- Growth in risk-weighted assets cost 22 basis points. This measure excludes foreign currency movements on credit risk-weighted assets.
- Other items added 6 basis points. Together, those first three movements produced the 36-basis-point gain.
- The FY2026 final dividend deducted 85 basis points. The net movement was a fall of about 49 basis points, consistent with the rounded closing ratio of 11.5%.
One detail matters here. Shareholders representing 12.4% participation took up the dividend reinvestment plan, but CBA bought the necessary shares on market. It did not issue fresh shares under the plan to restore common equity. For the earnings backdrop to that distribution, Colitco’s analysis of CBA’s FY2026 cash profit covers the full-year result preceding the September disclosure.
Loan Growth Accounted for More of the Increase Than Deteriorating Credit Quality
A rise in risk-weighted assets can mean that a bank has written more loans, that existing exposures have become riskier, or both. CBA’s September figures give a sense of their relative importance.
Growth in lending volumes added AUD 8.4 billion to credit risk-weighted assets, mainly in commercial lending and Australian residential mortgages. Deteriorating credit quality added AUD 0.3 billion. After other movements, credit risk-weighted assets finished at AUD 429.945 billion, up AUD 7.242 billion over the quarter.
Operational risk accounted for a further AUD 2.234 billion increase. Smaller declines in traded market risk and interest rate risk in the banking book partly offset those gains. The result was a 1.7% rise in total risk-weighted assets.
For anyone tracking the CBA capital ratio, the practical point is that a new loan can use some of the bank’s capital capacity even when the borrower is making every payment on time. Treating the whole AUD 9 billion increase as evidence of bad loans would misread the quarter.
The Reported CET1 Headroom Was About 1.4 Percentage Points
How much of the headline amount was actually above the disclosed requirements? The clearest answer comes from the CET1 figures on page 18 of the report.
CBA reported that CET1 equivalent to 7.0% of risk-weighted assets remained after meeting minimum capital requirements. Its bank-specific buffer requirements totalled 5.60%: a 3.75% capital conservation buffer, a 0.85% countercyclical buffer and a 1.0% requirement reflecting the bank’s systemic importance.
Subtracting 5.60% from 7.0% leaves approximately 1.4 percentage points above those reported buffers, compared with about 1.9 percentage points in June. That is a calculation using the published, rounded figures. It is not a cash balance or an amount CBA has said it will distribute.
For shareholders, that comparison is more informative than the AUD 108.9 billion headline alone. Total regulatory capital barely moved, but some of its composition shifted from common equity towards Tier 2, and the bank had more risk-weighted assets to support. CBA finished the quarter above its disclosed buffers, with less CET1 headroom than it had three months earlier.
ALSO READ: Westpac Banking Strategy 2026: Can Business Lending Drive Future Returns?
FAQs
1. Was AUD 108.9 Billion Available for Dividends or Buybacks?
No. It was CBA’s total eligible regulatory capital, including common equity and qualifying capital instruments. It was neither surplus cash nor a proposed shareholder payout.
2. Why Does the Report Show CET1 Ratios of Both 11.5% and 11.6%?
They cover different parts of the bank. The 11.5% figure applies to the Level 2 consolidated banking group used throughout this article. CBA reported 11.6% at Level 1.
3. Did the Lower CET1 Ratio Mean CBA Failed to Generate Capital?
No. Earnings added 52 basis points to CET1 during the quarter. The final dividend and growth in risk-weighted assets outweighed that contribution.
4. Is Regulatory Capital the Same as Liquidity?
No. Capital helps a bank absorb losses. Liquidity concerns its ability to meet payments as they fall due. CBA reports the two separately.
Disclaimer: This article provides general information, not personal financial advice. Amounts are in Australian dollars unless otherwise stated.

Luke Carlino is a seasoned Copywriter, Content Strategist, and Social Media Manager specialising in Mining, Finance, and Business journalism. With more than a decade of industry experience, he brings rigorous editorial standards and commercial acuity to every project.