
Bitcoin’s on-chain activity has climbed to levels last recorded before the 2021 bull run, even as prices retreat sharply. Data from multiple analytics platforms show rising network growth, whale accumulation, and expanding liquidity during a period of broad market weakness.
Network Growth Mirrors Pre-2021 Rally Conditions
On-chain metrics indicate Bitcoin’s Network Growth has reached extreme levels comparable to early 2021. At that time, the metric preceded BTC’s surge to new all-time highs. Current data suggests a similar acceleration in user activity and liquidity expansion.
Swissblock shared on X that both Network Growth and Liquidity are showing recovery signals. The post noted that similar readings in 2021 appeared shortly before Bitcoin entered its final bullish phase. However, prices are currently moving in the opposite direction.
The last time Network Growth & Liquidity hit these extreme levels was in 2021, right before BTC’s final push to a new ATH. We are starting to see a recovery in these metrics, signaling a potential final bullish episode.
While the divergence—rising metrics vs. falling… pic.twitter.com/vAHo8OOMZV
— Swissblock (@swissblock__) February 2, 2026
This divergence between expanding network metrics and falling prices has drawn attention across the market. Analysts are monitoring whether sustained growth can stabilize price action in the coming weeks.
Daily Transactions Reach Multi-Year High
Bitcoin’s network processed 428,725 daily transactions as of January 29. That figure represents a 20.65% increase compared to the previous year. It also marks the highest daily activity level since May 2021.
Despite this growth, Bitcoin’s price dropped below $73,000 earlier this month. The asset briefly touched around $74,600 before rebounding toward $78,300. The rebound followed increased retail selling during the decline.
The contrast between record transaction volumes and declining prices has raised questions about market structure. Elevated activity may reflect foundational usage rather than speculative trading.
Social Sentiment Turns Sharply Bearish
Bitcoin has fallen roughly 16% since January 28. Social media sentiment has deteriorated during that period. Santiment reported that bearish sentiment has reached levels not seen since the November 21 crash.
According to Santiment data, extreme negativity has historically preceded short-term relief rallies. Recent price movement toward $78,300 resembles previous post-FUD recoveries. Early trading patterns suggest a similar bounce may be forming.
Retail participants appear to be selling into weakness. Meanwhile, analysts note that markets often move contrary to dominant crowd narratives. The coming sessions may test whether this pattern holds.
Whale Accumulation Hits Three-Year High
Large Bitcoin holders have increased their positions during the downturn. The number of entities controlling more than 1,000 BTC has climbed to 1,678. That is the highest count recorded in three years.
Each of these wallets holds assets worth more than $66 million at current prices. The increase indicates steady accumulation among large investors. Historically, rising whale counts during price declines have coincided with long-term positioning.
This accumulation contrasts with softer retail sentiment. While smaller investors reduce exposure, large holders appear to be building reserves. Such positioning may create a price floor if selling pressure eases.
Mining Difficulty and Profit Pressure Persist
Bitcoin’s hashrate reached a monthly average of 1,082 exahashes per second in October. That level represents a record high for network security. However, it has increased operational strain on miners.
Mining difficulty now stands 80% higher than before the April 2024 halving. The adjustment has reduced miner profitability for three consecutive months. Daily block reward gross profit fell 4% during the latest period.
As margins compress, miners may sell more Bitcoin to cover costs. This dynamic introduces additional supply into the market. Selling from miners remains a counterweight to strong on-chain demand.
Analysts Project Potential $104,000 Target
Market commentator The Milk Road previously forecast Bitcoin’s decline from its October 2025 all-time high. The analyst now projects a potential 40% rally following a key pivot window between November 19 and February 2.
Bitcoin fell approximately 40% from its October 6, 2025 peak to February 2. This drawdown aligns with previous cycle behavior. According to the cycle model shared publicly, a rebound phase could now unfold.
The projection suggests Bitcoin may reach $104,000 between now and September if momentum builds. However, the analyst also noted the possibility of deeper corrections ranging from 20% to 77% before stabilization.
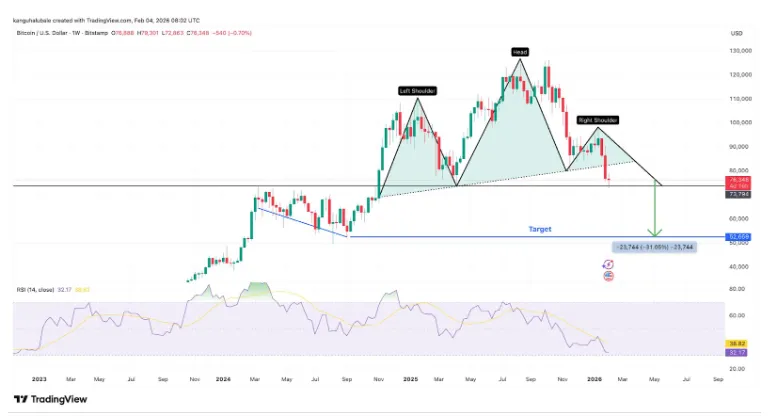
Bitcoin has declined roughly 40% from its October 2025 peak before staging a rebound. (Source: TradingView)
Indian Investors Buy the Dip Amid Regulatory Clarity
While global sentiment remains cautious, Indian investors are purchasing Bitcoin during the downturn. CoinDCX reported increased trading volumes despite falling prices. Monthly exchange volume rose from $269 million in December to about $309 million in January.
CoinDCX CEO Sumit Gupta stated that investors are focusing on long-term fundamentals. He cited systematic investment plans and deliberate order placements as evidence of maturing behavior. Ether, Solana, and XRP were also named among preferred assets.
Bitcoin recently traded near $75,000 after reaching over $126,000 in October. At the same time, the Indian rupee depreciated to a record 92 per U.S. dollar. Even so, exchange activity has remained balanced between profit-taking and accumulation.

Indian investors increased trading activity during Bitcoin’s recent price decline. (Source: iStock)
India continues to classify digital assets as taxable Virtual Digital Assets. The Union Budget 2026 maintained a 30% tax on gains and a 1% transaction tax. Exchanges must comply with strict reporting requirements under Financial Intelligence Unit regulations.
CoinDCX stated it remains committed to regulatory compliance as the framework evolves. The exchange reported steady participation from long-term investors during the recent decline.
Bitcoin’s network activity now resembles levels last seen before the 2021 rally. At the same time, price action remains under pressure from miner selling and cautious sentiment. Market participants are watching whether sustained adoption and whale accumulation can shift momentum in the months ahead.
Also Read: Deutsche Börse 360T Partners With Bitpanda for MiCA Crypto
FAQs
- What is Bitcoin network growth?
Bitcoin network growth measures the increase in new addresses and transaction activity on the blockchain. It is often used to assess adoption trends and user participation.
- Why is rising network growth important for Bitcoin?
Rising network growth suggests more users are interacting with the blockchain. Historically, sustained growth has coincided with stronger market phases.
- What does high daily transaction volume indicate?
Higher daily transaction counts can signal increased usage of the Bitcoin network. It may reflect greater adoption, transfers between wallets, or trading-related movements.
- What is a Bitcoin whale?
A Bitcoin whale is an entity that holds a large amount of BTC, typically more than 1,000 coins. Whale activity is closely monitored because large transactions can influence market liquidity.
- What does whale accumulation mean?
Whale accumulation refers to large holders increasing their Bitcoin balances. This behavior often occurs during market downturns when prices are lower.
- What is Bitcoin mining difficulty?
Mining difficulty measures how hard it is to validate new blocks on the Bitcoin network. It adjusts periodically to maintain consistent block production times.
- How does mining pressure affect Bitcoin’s price?
When mining costs rise and profitability declines, miners may sell more Bitcoin to cover expenses. This can increase short-term supply in the market.
- What is Bitcoin liquidity?
Liquidity refers to how easily Bitcoin can be bought or sold without causing major price fluctuations. Higher liquidity typically reflects stronger market participation.
- Why can price fall while network activity rises?
Price movements are influenced by supply and demand dynamics in trading markets. Network activity may increase due to transfers, accumulation, or structural usage, even during price declines.


