Bitcoin traded near the upper end of its recent range as traders reacted to firm technical signals and shifting United States policy cues, while strong volume on major platforms showed sustained participation across the crypto market during the latest trading session.
Price action on the four hour Bitcoin chart
The four hour TradingView chart placed Bitcoin near 97,477 dollars during the latest candle, which showed a modest intraday gain.
Price had recovered strongly from the earlier 80,537 dollar trough, forming a visible sequence of higher highs and higher lows.
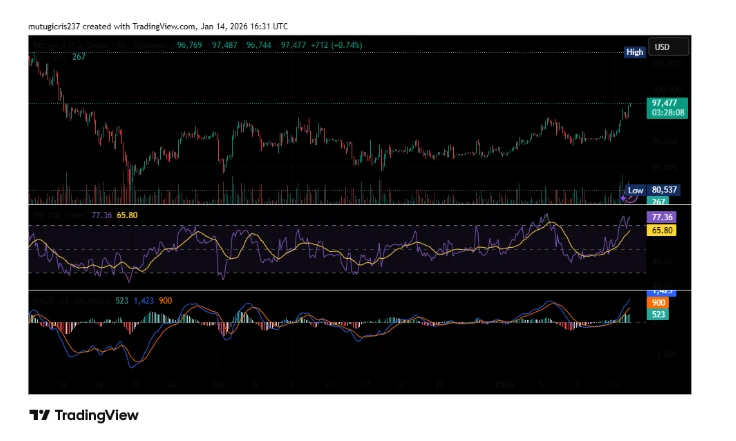
The four-hour Bitcoin chart shows a sustained recovery from the $80,537 low toward key resistance near $100,000. (Source: TradingView)
That structure confirmed a medium term uptrend, since sellers failed to defend prior resistance zones.
Moreover, the market now traded near the upper boundary of its recent range, close to the widely watched 100,000 dollar level.
This area has attracted steady interest from both buyers and short term traders.
The chart showed price clustering between roughly 97,800 and 98,500 dollars, which signalled short term balance rather than rejection.
Pullbacks during this phase remained shallow and contained within the rising channel.
Therefore, the four hour view still pointed toward trend continuation, even as short term consolidation remained possible.
Technical signals from momentum indicators
The relative strength index on the four hour chart printed near 77.36, which placed it deep inside overbought territory.
However, in trending markets, this reading often accompanies sustained demand rather than immediate selling pressure.
The moving average of the RSI hovered near 65.80, which confirmed the dominance of buyers during the recent advance.
This condition often supports brief pauses instead of sharp pullbacks, as traders wait for the next directional cue.
The MACD indicator also supported this narrative, since the MACD line remained well above the signal line.
Its positive histogram showed expanding bars, which reflected growing upside momentum across successive candles.
No visible bearish divergence appeared on either the RSI or MACD during this stage.
As a result, the technical picture stayed aligned with the ongoing bullish structure visible on the price chart.
CoinMarketCap data and intraday behaviour
On CoinMarketCap, Bitcoin traded near 97,020.15 dollars, showing a 3.82 percent gain over the previous twenty four hours.
Market capitalisation rose in step to about 1.93 trillion dollars, which confirmed that the move was broad based.
Trading volume reached roughly 64.26 billion dollars, which represented a 56.85 percent increase during the same period.
Such growth pointed to heavy participation rather than thin or erratic trading conditions.
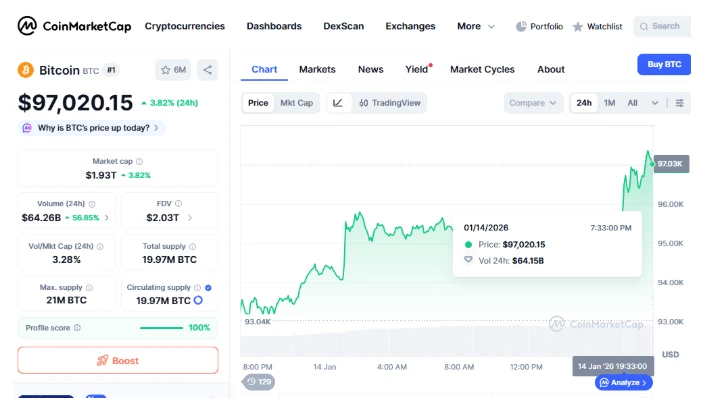
Bitcoin’s 24-hour trading volume climbed above $64 billion as price advanced toward $97,000. (Source: CoinMarketCap)
The intraday chart showed Bitcoin opening near the 93,000 to 94,000 dollar zone before staging a sharp upward move.
After that breakout, price consolidated tightly between about 95,800 and 96,300 dollars, which suggested steady absorption of supply.
A second push then lifted the market toward the 97,000 dollar region, where price again paused in a narrow band.
This pattern of impulse followed by consolidation often appears during trend continuation phases.
Volume and participation across the market
The surge in trading volume during the advance provided strong confirmation for the price move.
Rising price accompanied by rising volume usually signals genuine demand rather than a temporary drift driven by thin order books.
Volume expanded sharply during the initial breakout from the 94,000 dollar base.
That behaviour aligned with accumulation, since buyers appeared willing to transact at progressively higher levels.
As price approached the 97,000 dollar zone, volume eased only slightly rather than collapsing.
This pattern suggested that participants remained engaged while the market waited for a catalyst.
Such volume profiles often appear when traders prepare for a possible extension or a short term pause.
They also indicate that market confidence remained firm despite the proximity of major psychological resistance.
Macro data from the United States economy
Recent United States macro releases have played a role in shaping market sentiment.
A labour report released on Friday showed that the economy created only about 50,000 jobs during the period.
At the same time, the unemployment rate improved to 4.4 percent, which presented a mixed picture of labour conditions.
Such data often supports expectations for easier monetary policy, especially when job growth slows.
Another report released on Tuesday showed that core consumer inflation eased during December.
It fell from 2.7 percent in November to 2.6 percent, which suggested that price pressures were moderating.
Traders have watched these numbers closely, since lower inflation and softer labour data can support rate cuts.
Lower rates often improve the appeal of risk assets, including cryptocurrencies.
Policy moves under the Trump administration
Donald Trump has also placed affordability at the centre of his current political agenda.
He announced a cap on credit card interest rates, which aimed to ease pressure on household budgets.
The administration also barred institutional investors from purchasing homes, which targeted rising property prices.
In addition, Fannie Mae was asked to buy more than 200 billion dollars in mortgage securities.
Trump has urged domestic oil producers to increase output as well.
This move aimed to reduce fuel costs, which can feed into lower consumer prices across the economy.
Together, these measures have contributed to expectations of softer inflation trends.
Such conditions often support looser Federal Reserve policy, which can benefit digital asset markets.
Regulatory developments and the CLARITY Act
Crypto markets have also responded to developments in the United States regulatory environment.
The Senate released the text of the CLARITY Act ahead of its markup session scheduled for Thursday.
This bill has drawn attention from market participants, since it aims to clarify oversight of digital assets.
Its progress followed the earlier passage of the GENIUS Act, which addressed related regulatory themes.
A post from the Angry Crypto Show account on social media quoted SEC Chairman Paul Atkins on the matter.
He stated that the bill reaching the president this year would help both the crypto marketplace and investors.
JUST IN: 🇺🇸 SEC Chairman Paul Atkins on the CLARITY Act, says “we are very bullish on the effects of the bill getting to the President to be signed this year, and I think that’ll be a huge help to the crypto marketplace and investors.” $ADA $NIGHT pic.twitter.com/Vliud9T6LZ
— Angry Crypto Show (@angrycryptoshow) January 13, 2026
The message circulated widely and added to the sense that regulatory conditions were becoming more predictable.
That perception often supports investor confidence, especially among institutions and long term holders.
Court rulings and tariff expectations
Another factor watched by traders has been the pending ruling by the Supreme Court on Donald Trump’s tariffs.
A decision was expected later in the day, which kept risk assets in focus across global markets.
A Kalshi poll showed that the odds of the court upholding the tariffs stood near 33.8 percent.
Those odds had dropped sharply from above 56 percent during September of the previous year.
A ruling against the tariffs could lead to lower import costs for many companies.
Lower prices could ease inflation pressures, which often supports more accommodative central bank policies.
Although Trump still has other tools to pursue similar measures, those options would require longer procedures.
For now, traders have focused on the immediate ruling as part of the current macro backdrop.
Support and resistance levels in focus
Across both the four hour and twenty four hour charts, several price levels have drawn attention from traders.
On the downside, the 95,800 to 96,000 dollar zone has acted as short term support following the latest breakout.
A deeper support area sits between 94,000 and 94,500 dollars, where Bitcoin based earlier during the session.
On the larger time frame, the 90,000 to 92,000 dollar band remains an important structural floor.
On the upside, the market has faced near term resistance around 97,300 to 97,500 dollars.
Above that zone, traders have watched the 98,500 to 100,000 dollar region as the next major barrier.
These levels have guided short term trading behaviour as volume has remained elevated.
They also frame the ongoing consolidation near recent highs.
Also Read: Rial in Freefall: Iran’s Currency Crisis Sparks Bitcoin Rush
Market tone during the latest session
Taken together, the charts and data pointed toward a risk on tone across the crypto market.
Bitcoin held its gains near the upper end of the range, rather than retracing toward earlier support.
The steady volume profile suggested that traders continued to participate during the consolidation phase.
Such behaviour often accompanies periods when the market prepares for its next directional move.
Macro data from the United States has also reduced concerns about immediate monetary tightening.
At the same time, regulatory signals have offered a more defined framework for digital asset activity.
These elements combined to support the current trading environment.
Bitcoin therefore remained positioned near key resistance while market participants monitored both charts and policy developments closely.