
Ethereum is trading at approximately $4,280, ranging below a resistance area of $4,350. Market sentiment has lost sheen after the sudden drop in the trading volume. Technical as well as on-chain indicators indicate key support areas being established short-term direction.
Price Overview and Market Activity
The Ethereum price stands at $4,279.84 and has a weak 24-hour decline of 0.46 percent. The latest traded price on the chart is around $4,292, trading slightly higher than listed average but within the same range.
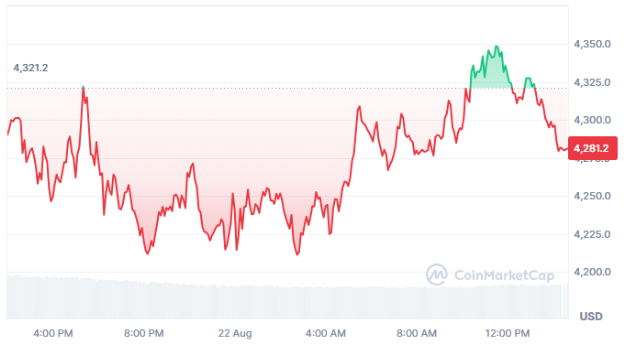
Source: CoinMarketCap
Market cap is $516.6 billion, down by 0.45 percent within the same time period. Fully diluted capitalization is almost identical at $516.66 billion, indicating the circulating supply is nearly identical to the total supply.
Volume has dried up considerably to $35.5 billion in the previous 24 hours. It is a massive drop of 214.14 percent from the previous period, which shows dwindling participation. The volume-to-cap ratio stands at 7.01 percent, which shows healthy liquidity but shrinking momentum.
Intraday Performance and Key Levels
Ethereum began at $4,293.9 and fell directly down to the levels of approximately $4,225 before going up to the peaks of nearly $4,350. The asset reversed back from here to the levels of $4,280–$4,290, which is the current trading level.
Support is at $4,350 with sellers present there. Support is between $4,225 and $4,250, which was the base when there was consolidation in the morning. Psychological support is $4,200, and a break above $4,350 brings us to $4,400–$4,500.
Short-Term Chart Signals
On the 5-minute chart, Ethereum experiences wide price oscillations from lows of approximately $4,064 to highs of approximately $4,350. Price declined from above $4,300 to $4,064 between August 18 and 19 before rising on August 20.
The rebound set the price above $4,250, where it has been trading sideways since. Resistance remains at $4,350, while the support has remained above $4,200. Ranging between $4,250–$4,350 indicates market uncertainty.
Technical Indicators Update
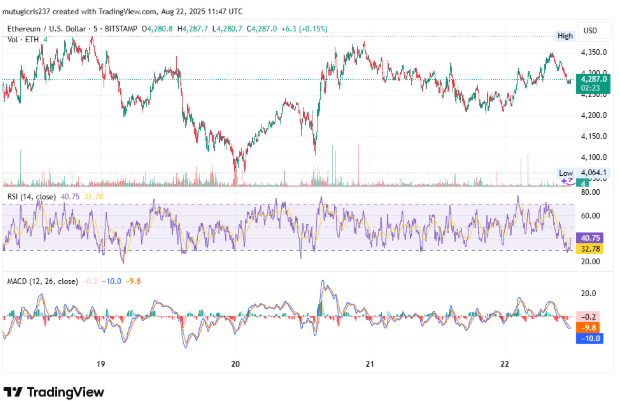
Source: TradingView
Relative Strength Index stands at 31.95, barely above the oversold level of 30. This suggests waning selling strength, which should bring short-term comfort if levels stay above 30.
Moving Average Convergence Divergence continues in bearish levels since the MACD line is -10.4 and the signal line is -8.0. The histogram is -2.5, but the narrowing gap between the lines shows weakening bearishness.
On-Chain Cost Basis Analysis
A recent cost basis distribution chart by Glassnode, tweeted by analyst @ali_charts, shows strong support for Ethereum supply. At approximately $4,249–$4,265, roughly 628,000 ETH accumulated, which created an instantaneous area of support near the present trading range.
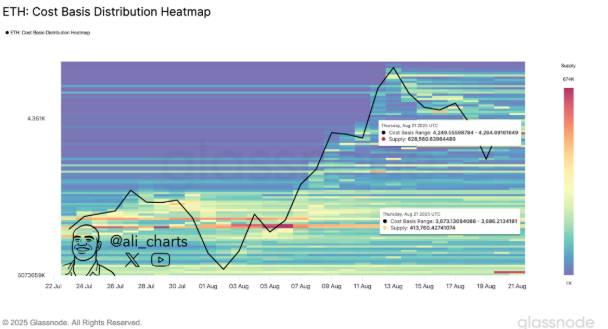
Source: Ali On X
There is a second build-up zone between $3,673–$3,686 in which nearly 414,000 ETH were bought. This zone then becomes the next support base if the $4,260 level fails to hold. These numbers represent two significant short-term positioning zones.
Trading Scenarios
Ethereum, if it continues to get support at $4,260 and also breaks above the resistance of $4,350 level, can see prices rise to $4,400–$4,500 with some upbeat traction. Continued buying volumes would be required to support such a rise.
If breaking below support levels at $4,225, prices may slide to $4,200 and later test $4,150–$4,064. Continued decline below $4,260 could reveal the $3,700 cost basis region, where demand can resurface once more.
Also Read: https://colitco.com/moving-from-hype-to-action-ai-training-edtech-australia/
Final Thoughts
Ethereum is still consolidating, moving between strong support levels of $4,260 and resistance levels of $4,350. Volume has also been declining, and the possibility of quicker movements increases once the range has been broken. The direction of the subsequent breakout will determine whether Ethereum is trying to advance towards $4,500 or retreat to $3,700.