
Charter Hall Social Infrastructure REIT provided a better performance in its CQE HY26. Operating earnings increased by 11.8% to 8.5 cpu as compared to 1H FY25. Distribution increased to 8.4cpu, which is 12.0 % year on year.
The net property income increased by 10.5 % to reach 59.1 million. Operating earnings have gone up to 31.4 million.
The social infrastructure REIT attributed growth in rentals and accretive acquisitions. The income, on a like basis, increased by 4.1%. Review of market rent provided a 6.1% boost. Finance expenses have increased because of increased debt drawn.
Nevertheless, the income strength stood in favour of refurbished instructions. Another advantage to investors was the secure occupancy and extended leases.
Western Sydney University campus, Parramatta, NSW. [SLIIT]
CQE HY26 Results Highlight Accretive Portfolio Curation
The CQE HY26 findings have shown active portfolio transformation in 308 of the properties. CQE purchased assets of 180.7 million at an average yield of 6.8. Divestments were of 88.9 million at a yield of 4.3%.
The management bought 20 properties at a premium of 4.6 to the book value. The REIT became more exposed to long WALE social infrastructure.
New investments further increased the higher education weightings. Early learning, health, universities and government services have been incorporated in the portfolio. WALE is at 11.4 years, and it favors predictable cash flow.
There is a low frequency of lease income expiry that falls short of five years (4.2%). Occupancy remains strong at 99.6%. These indicators emphasise defensive positioning.
How Did Acquisitions Strengthen Income Visibility?
CQE increased the exposure to higher education at the Parramatta campus of Western Sydney University. The trust purchased a 50 % interest in the value of $152.02 million. The initial yield measured 6.5%. The lease term extends 16.14 years.
Further options add 15 years. Annual rent increases are pegged at 3.75 %. The contemporary plant covers a land area of approximately 26,500 sqm. The property has 5-Star Green Star and 5-Star NABERS ratings.
Its central business area is a good site with high tenant demand. These characteristics increase sustainability and certainty of income. The shift is in line with CQE’s specialisation in key services.
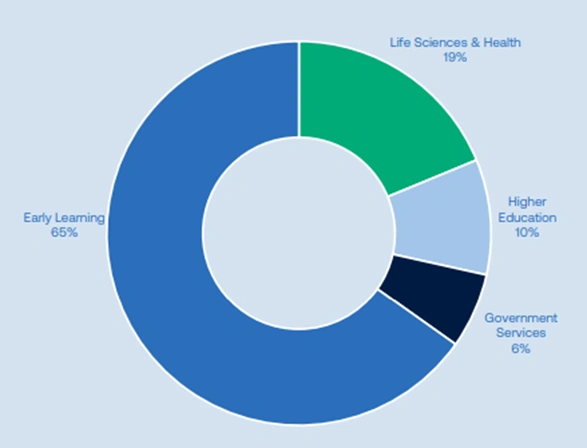
Portfolio income mix showing Early Learning at 65%, followed by Life Sciences & Health 19%, Higher Education 10%, and Government Services 6%. {ASX}
Financial Performance Remains Stable And Defensive
There was sound capital management as shown by the balance sheet measures. Total assets increased to 2255.7 million as compared to 2130.0 million. There was a rise in investment properties to $2,021.6 million.
The net tangible assets amounted to $1,447.9 million. NTA per unit lifted to $3.90, up 1.0%. Debt drawn stood at $781.0 million. The balance sheet gearing was at 34.1%. Weighted average debt maturity came to 4.4 years.
The cost of debt averaged 5.1%. The hedging was 81 % at 3.3 %. The last refinancing of CQE facilities had been done in July 2025. The platform got additional tenure and better prices. These safeguard the earnings against fluctuations in the rates.
What Supports Rental Growth Across The Portfolio?
Rental development is also a major source of revenue. WARR stood at 4.2% through like-for-like assets. Fixed annual increases on 69 % income benefits are close to 3 %.
16 % undergoes market reviews till FY28. CQE completed 58 reviews in 1H FY26. Such reviews posted a 6.1% increase or 0.7 million.
The growth of fees was 8.4 % by early learning operators. The average daily charges increased to 155 dollars from 143.
Net rent to revenue stayed at 9.7%. These environments give room to additional development. Long-term investors are still drawn to portfolio fundamentals.

Early learning childcare centre property in the CQE portfolio. [Charter Hall]
Outlook Signals Continued Momentum For FY26
The CQE HY26 results led to a management improvement of FY26 guidance. EPU guidance has a minimum of 17.2 cpu. Distribution direction improved to 17.0 cpu. That represents 11.8% growth on FY25.
Strategy emphasises stakeholders such as the key community resources, with support on the part of the government. Opportunities are based on population growth and education. The federal expenditure on healthcare, education and early learning is more than 200 billion in a year.
There were property transactions of early learning that amounted to 943 million in CY25. These trends are in favour of liquidity and valuations.
CQE projects strong revenues and stable capital increase. Charter Hall Social Infrastructure REIT seems to be geared towards defensive growth.
FAQs
Q1: What are the CQE HY26 results?
A1: They are Charter Hall Social Infrastructure REIT’s half-year financial results for FY26, covering earnings, assets and guidance.
Q2: How much did operating earnings increase?
A2: Operating earnings per unit rose 11.8% to 8.5 cpu compared with 1H FY25.
Q3: What is the current portfolio occupancy rate?
A3: Occupancy stands at 99.6%, reflecting stable tenant demand.
Q4: What is FY26 distribution guidance?
A4: CQE upgraded FY26 DPU guidance to 17.0 cpu, up 11.8% on FY25.