XRP is trading below the $2.90 level, which is showing signs of weakness on multiple timeframes. Technical levels show key resistance levels and support levels that will drive short-term price action in future sessions.
Intraday Price Performance
XRP recently changed hands at $2.87206 in the last trading session on Bitstamp. The day’s high was $2.87593, and the day’s low was $2.84782. Price action has been in tight ranges, yet bearish inclination dominated as the rejection at prices over $3.10.
The –0.00326 (-0.11%) session close indicates tenuous attempts at recovery. Intraday charts illustrate sustained selling pressure near $2.90 that is keeping the buyers on the defensive and limiting upside power.
Market Indicators Suggest Weakness
The Relative Strength Index (RSI 14, close) was at 30.55, barely below the oversold point of 30. It reflects selling momentum exhaustion but not reversal yet. The RSI midpoint of neutrality at 49.03 reflects the price remaining in bearish conditions.
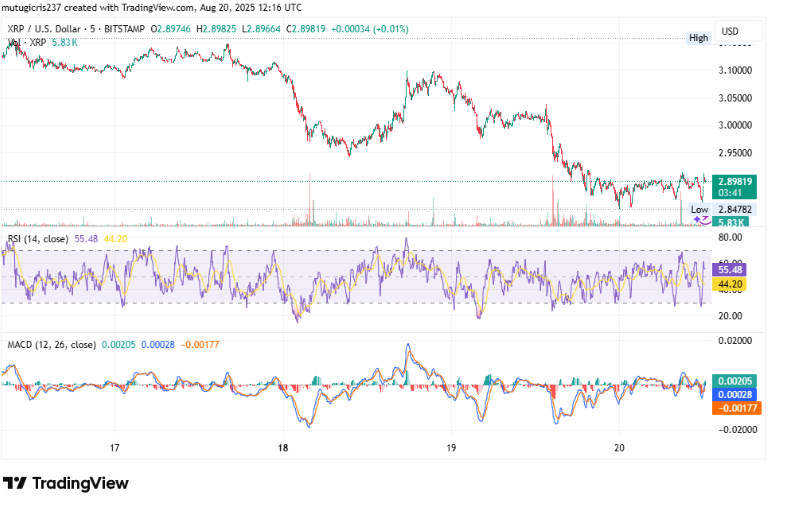
Source: TradingView
The MACD (12, 26, close) also confirms the trend. The MACD line of –0.00284 is lower than the signal line of –0.00052, with a bearish histogram of –0.00233. This shows consistent downside momentum with no bullish crossover.
Resistance Levels Maintain Pressure
The short-term resistance level is placed at $2.90 – $2.92. The level has been acting as a cap, stopping all recovery attempts in past sessions. A move above it can lead to the $2.95 level.
Also Read: Corrupt Former Labor MP Eddie Obeid Walks Free on Parole After Years Behind Bars
Deeper, there is stronger resistance at $3.00 – $3.05, where previous breakdowns have been seen. Buyers will need to see firm volume confirmation before they can reclaim this zone, as consecutive failures close to $3.00 created tight selling walls.
Support Areas in Focus
The first support level is $2.85 – $2.86, tested time and time again. A failure here can push prices into the $2.82 – $2.80 area, with XRP open to more corrections.
In the event of higher selling, the next area to watch out for is $2.75 – $2.78, where short-term traders may attempt to hang on. Below that, collective downside risks can emerge, pushing prices towards $2.70.
Broader Timeframe Signals
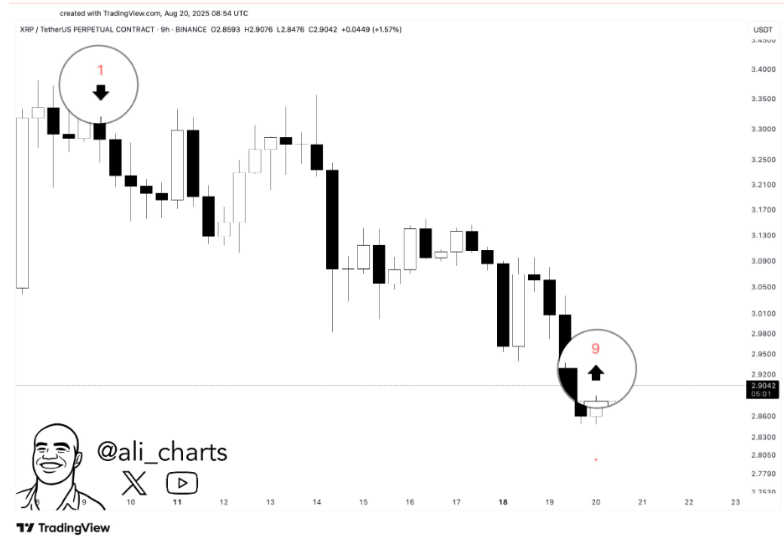
Source: Ali on X
XRP has just printed a TD Sequential 9 count on a 9-hour Binance chart at $2.85 – $2.86. This indicator typically indicates trend exhaustion following nine straight candles in the same direction. The signal after emerging from a steady downtrend from the range of $3.34 – $3.40.
While this setup here is hinting at a possible reversal, this must be confirmed by further trade above $2.92. Lacking momentum, however, the reversal signal can be watered down as sellers maintain control of the larger picture trend.
Market Capitalization and Volume
According to market observers, capitalization of XRP is $171.33 billion, equivalent to the 4.42% intraday price drop. Fully Diluted Valuation (FDV) of XRP is $288.34 billion, based on the total supply of nearly 100 billion tokens.
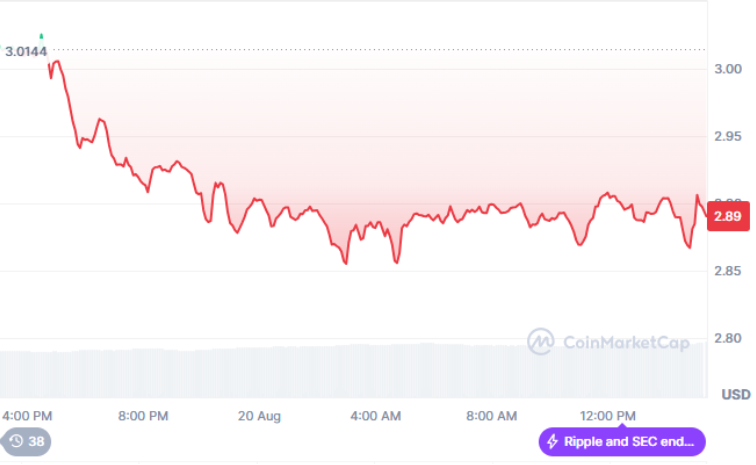
Source: CoinMarketCap
24-hour volume totaled $7.19 billion, up 12.88%. A 4.18% volume-to-market cap ratio reflects participative trading, though trading has been more in the selling than accumulation mode.
Future Price Scenarios
If XRP can maintain $2.85 support, a move to $2.90 – $2.95 can follow. Breaking above $2.95 will aim for the $3.00 – $3.05 resistance zone, with potential to move up to $3.17 if the momentum gains.
Bearish-wise, failure to hold $2.85 can set the stage for another test at $2.80. Break of this level can give sellers power towards $2.75 – $2.70, while the broader bearish setup remains intact.
Summary of Current Conditions
XRP is currently trading at $2.88, with support at $2.90 – $2.95 and resistance at $2.85 – $2.80. Technicals are bearish since RSI is still lower than 50, and MACD is bearish. TD Sequential count at $2.85 shows that there is a chance for a bottom, but recovery of price above $2.92 must occur to confirm. Otherwise, bearish momentum remains to control short-term price action.