
Commonwealth Bank of Australia (CBA) released its Basel III Pillar 3 Report as at 30 September 2025. The report details the bank’s capital adequacy, risk-weighted assets (RWA), leverage, liquidity ratios, and credit risk exposures for the September quarter. The data complies with the Australian Prudential Regulation Authority (APRA) standards and Basel Committee on Banking Supervision (BCBS) frameworks.
Commonwealth Bank of Australia released its Basel III Pillar 3 Report
Capital Position and Movement
CBA’s Group Basel III Common Equity Tier 1 (CET1) capital ratio stood at 11.8% on 30 September 2025. The Tier 1 and Total Capital ratios were 13.3% and 20.3%, respectively. The CET1 ratio increased by 33 basis points during the quarter, adjusted for the 2025 final dividend impact of minus 87 basis points. This overall rise was primarily driven by earnings-generated capital growth of 51 basis points and regulatory adjustments of 3 basis points. These were partially offset by a net RWA increase that decreased ratios by 21 basis points. The Level 1 CET1 ratio was 11.7% compared to 12.4% on 30 June 2025.
The CET1 capital as of 30 September 2025 was $58.9 billion, while additional Tier 1 capital stood at $7.9 billion. Total Tier 1 capital reached $66.8 billion and Tier 2 capital was $35.1 billion. This resulted in total capital of $101.9 billion. Risk-weighted assets grew from $496.1 billion to $501.4 billion in the quarter.
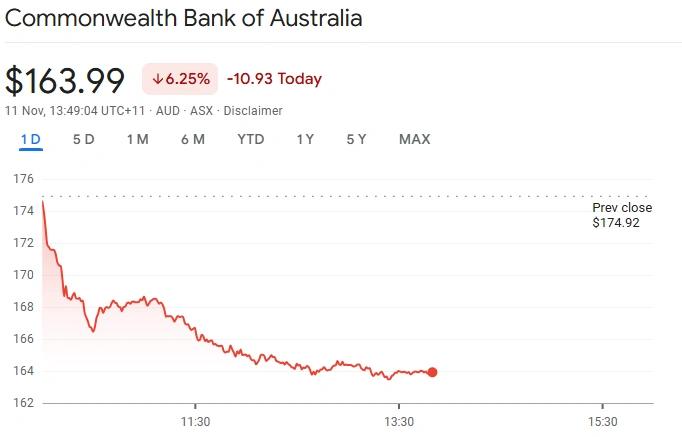
Decline seen in CBA’s share price
Capital Initiatives
The bank fully satisfied its Dividend Reinvestment Plan (DRP) for the final 2025 dividend through on-market share purchases, with a participation rate of 14.8%. It issued EUR 1 billion in subordinated notes in August 2025, consistent with Basel III Tier 2 compliance, and redeemed AUD 1.4 billion in subordinated notes in September 2025.
Risk-Weighted Assets Overview
Total RWA increased by $5.3 billion in the quarter, driven by credit risk and operational risk RWAs. Credit risk RWA increased by $2 billion, attributed mainly to volume growth across domestic residential mortgages, commercial portfolios, New Zealand operations, and financial institutions. Methodology changes, particularly a self-imposed residential mortgage risk weight floor increase, added $2 billion. These were offset by credit quality improvements, which reduced RWA by $3.4 billion, and foreign currency movements that decreased RWA by $3 billion. Traded market risk and interest rate risk in the banking book (IRRBB) RWAs remained stable.
Credit risk RWAs accounted for $400.9 billion of total RWA, while operational risk RWA increased by 7.2% to $51 billion due to higher net interest income from rising interest rates and lending growth. Traded market risk RWA was $9.7 billion, stable with slight quarterly variance. IRRBB RWA held steady at $39.8 billion.
Leverage Ratio Details
CBA’s leverage ratio was 4.5% as at 30 September 2025, down from 4.7% in June. This decline mainly resulted from the final dividend payment and increased exposures, partially offset by earnings-generated capital. The leverage ratio minimum requirement for internal ratings-based (IRB) banks like CBA is 3.5%.
Liquidity Coverage and Funding Ratios
The bank’s Liquidity Coverage Ratio (LCR) averaged 133% for the quarter, above APRA’s minimum 100% requirement. This represents a rise from 130% in the previous quarter, supported by increased high-quality liquid assets (HQLA) of $198.3 billion, up 7.8%. Net cash outflows rose 5.7%, reflecting growth in customer deposits and an increase in wholesale funding maturities within 30 days.
The Net Stable Funding Ratio (NSFR) improved marginally to 116%, compared to 115% in the prior quarter. The NSFR measures the proportion of stable funding sources available relative to the required stable funding for assets over a one-year horizon.
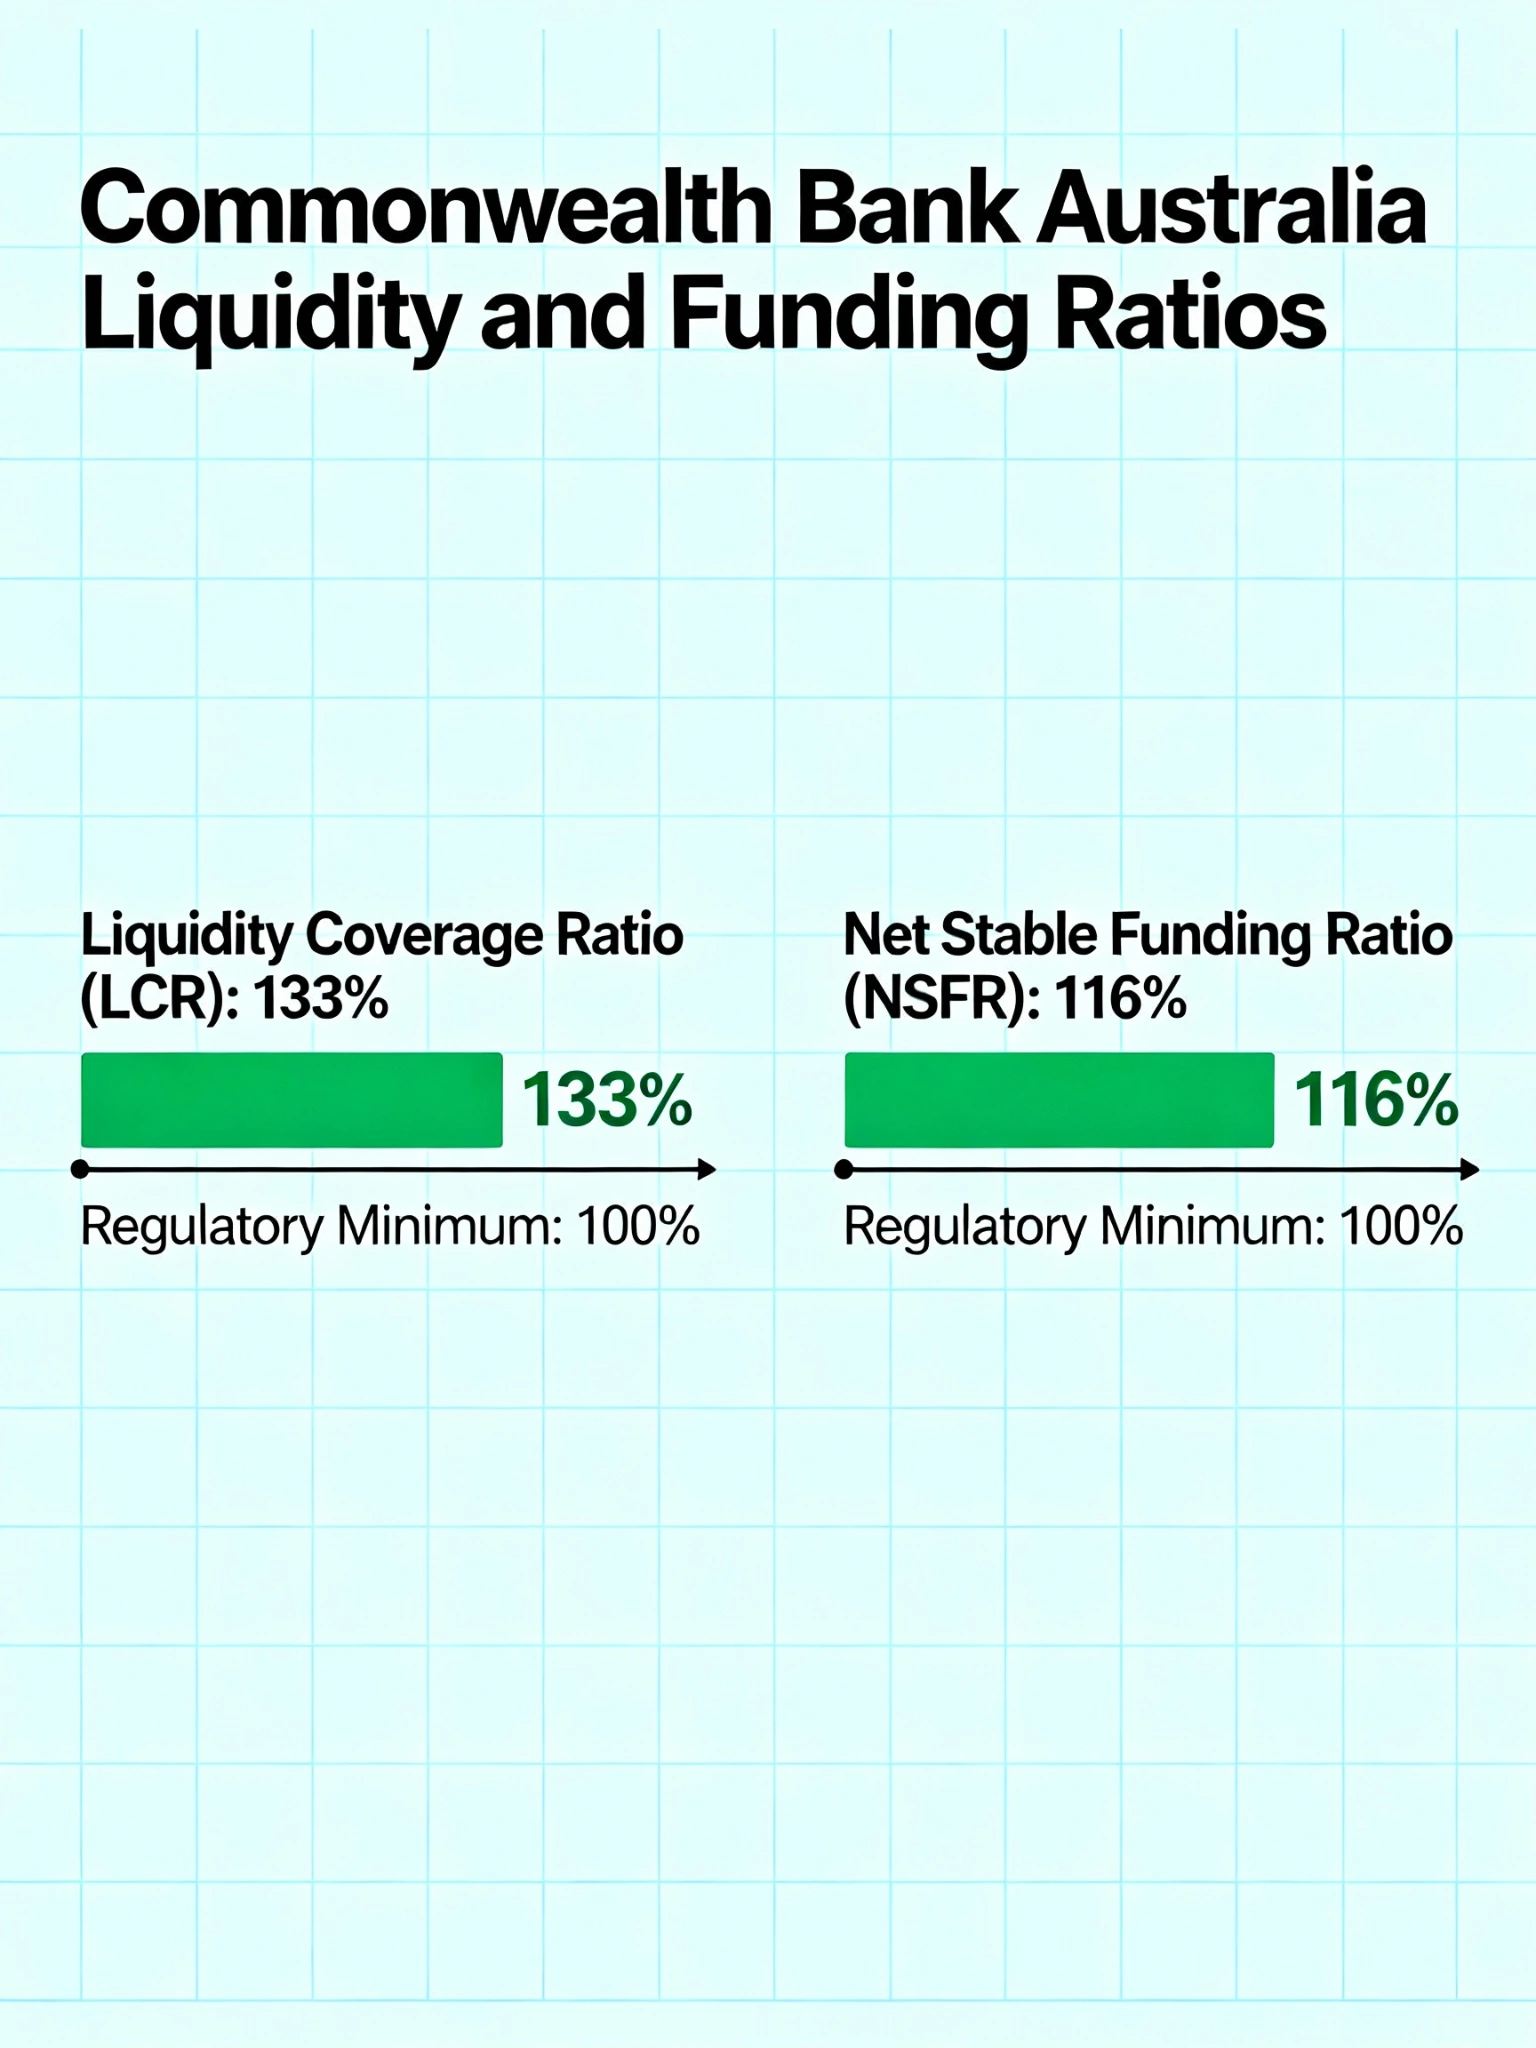
CBA Liquidity Metrics vs Regulatory Requirements
Credit Risk Exposures and Non-Performing Loans
Exposure at default (EAD) for credit risk was $1.355 trillion, with corresponding credit RWAs of $386 billion. The bank’s portfolio includes corporate, SME retail, residential mortgages, qualifying revolving retail, other retail, specialised lending, and financial institution exposures. Residential mortgage exposure amounted to $704 billion, the largest segment.
Non-performing exposures totalled $10.85 billion at 30 September 2025. Consumer loans accounted for $7.95 billion, followed by commercial property at $407 million and business services at $249 million. Specific provisions for these non-performing exposures were $1.5 billion, supporting actual losses of $178 million during the quarter. These figures were consistent with the previous quarter’s metrics.
Also Read: AGL Sells 19.9% Stake in Tilt Renewables in $750 Million Capital Shift
Industry-Specific Credit Exposures
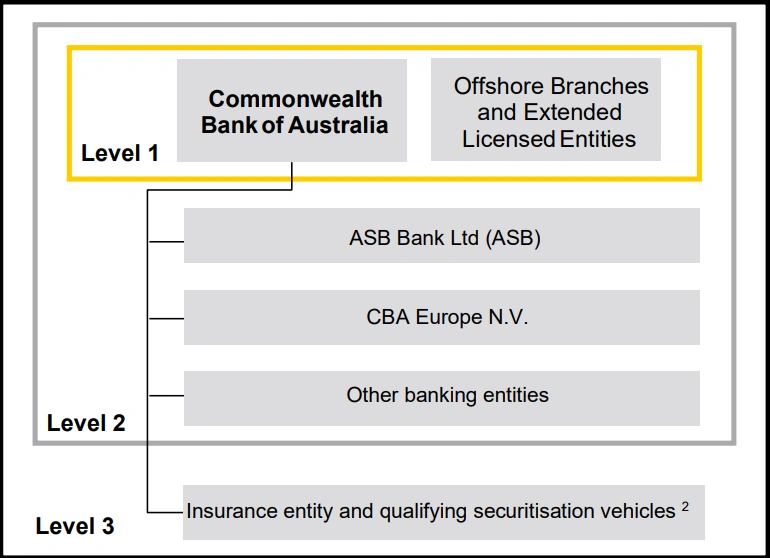
Credit exposures varied by industry sector. Manufacturing and commercial property sectors reported exposures of $17.3 billion and $99 billion, respectively. Government and sovereign exposures stood at $150 billion. The financial institution sector’s exposure was $35.9 billion. The bank also maintained exposure to New Zealand operations through ASB Bank Limited regulated by the Reserve Bank of New Zealand.
Management Attestation
Alan Docherty, Group Chief Financial Officer, attested that CBA’s prudential disclosures comply with APS 330 and Basel Committee standards. The disclosures were prepared according to the Group’s Board-approved disclosure policy and internal verification processes.
Conclusion
CBA demonstrated capital resilience in the September quarter of 2025. The bank maintained regulatory capital above minimum requirements, balanced growth in risk-weighted assets, and managed liquidity and leverage within APRA standards. Credit risk exposures across portfolios and industries remained stable, with provisions in place for non-performing loans. Liquidity buffers exceeded regulatory requirements, supporting the bank’s funding profile. The results provide stakeholders with transparency on CBA’s financial and risk position amid fluctuating market conditions.