
BKI Investment Company Limited (ASX: BKI) released its weekly pre-tax net tangible assets update. The BKI weekly NTA stood at AUD 1.95 per share as of Friday, 05 December 2025. The unaudited figure provides shareholders with transparency on portfolio valuation.

The share price closed at AUD 1.705 on the same date. This represents approximately 1a 2.6% discount to the reported BKI Investment Company NTA. Listed investment companies commonly trade at discounts or premiums to underlying asset values.
BKI Weekly NTA Update Shows Portfolio Performance
BKI Investment Company maintains a consistent weekly NTA reporting practice. The pre-tax NTA of AUD 1.95 reflects the underlying asset value before taxation provisions. This metric excludes deferred tax liabilities on unrealised capital gains.
The Company has maintained an ASX listing for over 20 years. Contact Asset Management manages the equity portfolio under a research-driven framework. BKI invests for the long term in profitable, high-yielding Australian companies.
Investment Portfolio Composition and Strategy
As at 30 June 2025, BKI held 39 stocks within its investment portfolio. The top 25 holdings plus cash accounted for 89.5% of the total value. Commonwealth Bank represented the largest single position at 10.1%.
The portfolio spans financials, industrials and consumer discretionary sectors. National Australia Bank comprised 7.4% of holdings. BHP Group accounted for 6.1% of the portfolio.
Financial Year 2025 Performance Highlights
BKI reported F25 annual results on 05 August 2025. The Company generated net profit after tax of AUD 61.9 million. This represented a 4% decrease from AUD 64.4 million in F24.
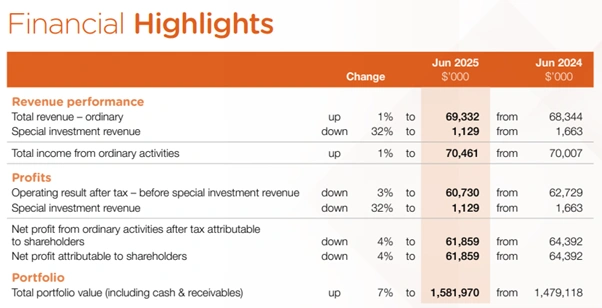
Figure 2: BKI Investment Company FY25 financial highlights
Investment portfolio revenue increased to AUD 65.1 million from AUD 64.0 million previously. Stronger dividend contributions came from Commonwealth Bank and Dalrymple Bay Infrastructure. Suncorp Group, National Australia Bank and Wesfarmers also contributed positively.
Basic earnings per share before special investment revenue totalled 7.53 cents. This compares to 7.83 cents per share in F24. Special investment revenue declined to AUD 1.1 million from AUD 1.7 million.
The total investment portfolio, including cash, reached AUD 1.47 billion at 30 June 2025. This marked 7% increase from AUD 1.37 billion at the prior year’s end. Net assets grew to AUD 1.44 billion from AUD 1.37 billion.
Dividend Distribution and Shareholder Returns
BKI declared a fully franked final dividend of 4.00 cents per share for F25. Total dividends for the year reached 7.90 cents per share. This increased 1% from 7.85 cents in F24.
All dividends paid by BKI since listing have been fully franked. The historical grossed-up dividend yield stood at 6.4% based on F25 dividends. This calculation uses a 3a 0% tax rate and AUD 1.755 per share at 30 June 2025.
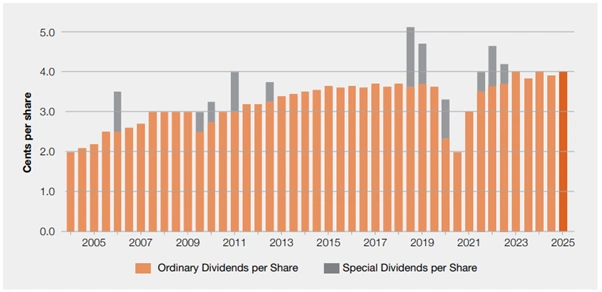
The dividend reinvestment plan remained available without a discount. BKI’s dividend payout ratio targets between 55% and 70% of net profit. The Company emphasises creating wealth through low costs and increasing dividends.
Management Expense Ratio Remains Competitive
BKI’s management expense ratio stood at 0.166% as at 30 June 2025. This decreased from 0.169% in the previous corresponding period. The Company avoids excessive external portfolio management fees.
BKI never pays performance fees to fund managers. The Board and Portfolio Managers hold shares in the Company. This aligns interests with all shareholders.
The low MER compares favourably to other listed investment companies. Exchange-traded funds and managed funds typically charge higher fees. Contact Asset Management provides investment management and company secretarial services.
Share Price Performance and Trading Activity
Shares currently trade at AUD 1.715 per share following the BKI NTA update 5 December 2025. The stock’s 52-week range spans AUD 1.527 to AUD 1.890 per share. Market capitalisation approximates AUD 1.37 billion based on 807.1 million shares on issue.
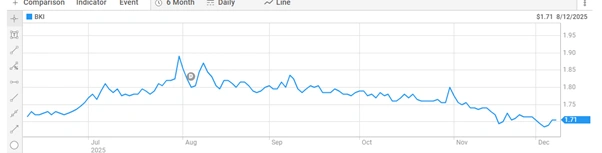
Figure 4: Six-month share price performance of BKI Investment Company (ASX: BKI)
The gap between BKI’s share price and net tangible assets moved over FY25 alongside shifts in investor sentiment. Over the year to 30 June 2025, the stock generated a total shareholder return of 11.5%, compared with a 15.2% return from the S&P/ASX 300 Accumulation Index.
The closing price of AUD 1.705 on 05 December 2025 reflects current market conditions. Investors weigh current dividend income against future capital appreciation potential. BKI’s focus on high-yielding Australian equities shapes its valuation profile.
ALSO READ: Treasury Wine Estates to Release 6.6 million Shares from DAOU Acquisition Escrow
FAQs
Q1: What does BKI NTA update 5 December 2025 represent?
BKI Investment Company NTA represents underlying asset value before taxation provisions. It excludes deferred tax liabilities on unrealised capital gains in the investment portfolio.
Q2: Why does BKI trade at a discount to NTA?
Listed investment companies commonly trade at discounts or premiums to underlying asset values. Market sentiment, dividend yields and portfolio composition influence this relationship.
Q3: What is BKI’s dividend policy?
BKI targets a dividend payout ratio between 55% and 70% of net profit after tax. The Company focuses on paying increasing fully franked dividends over time.
Q4: How often does BKI report its NTA?
BKI releases weekly NTA updates providing transparency on portfolio valuation. These unaudited and indicative figures appear each week following Friday market close.