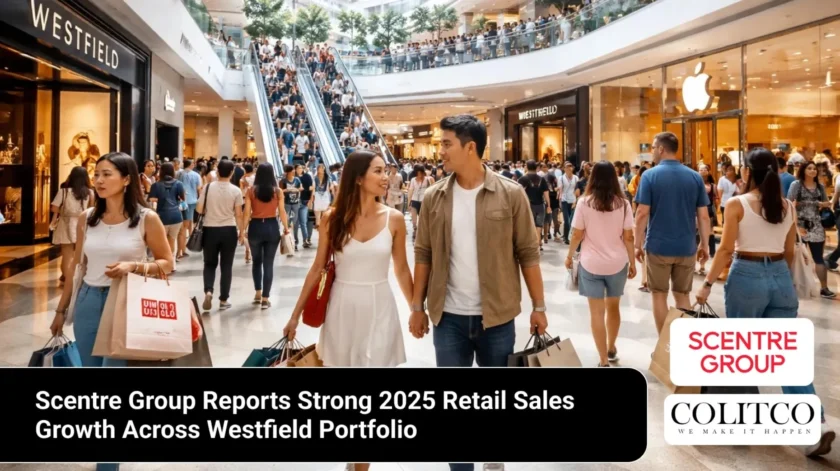
Scentre Group has reported steady growth in retail sales and asset values across its 42 Westfield destinations in Australia and New Zealand, according to its 2025 Property Compendium released on 24 February 2026. The update outlines performance metrics for the 2025 financial year and highlights rising specialty sales, strong trade area spending, and continued redevelopment activity.

Westfield Sydney recorded more than $1.15 billion in moving annual turnover sales in 2025, according to Scentre Group’s latest Property Compendium. [Reuters]
The group confirmed that its portfolio continues to capture significant retail expenditure across major metropolitan markets. The data shows consistent growth in moving annual turnover (MAT) sales across several flagship centres. Management stated that operating metrics reflect resilient consumer demand despite broader economic pressures.
Retail Sales Growth Across Westfield Centres in 2025
Retail sales growth remained a central feature of the 2025 property performance update. Several major centres recorded year-on-year increases in total sales and speciality store performance. For example, Westfield Miranda reported total MAT sales of $1.014 billion in 2025, up from $966 million in 2024.
Westfield Sydney recorded MAT sales of $1.157 billion in 2025, compared with $1.077 billion the previous year. Specialty sales at that location reached $903 million. Average sales per specialty store rose to $4.086 million, reflecting strong tenant turnover and high productivity per square metre.
Other metropolitan centres also reported gains. Westfield Parramatta delivered MAT sales of $1.092 billion in 2025, increasing from $1.047 billion in 2024. Speciality sales at that centre reached $748 million. These results demonstrate sustained demand across high-density trade areas.

Westfield Parramatta reported increased specialty store sales and rising average sales per store in 2025. [Scentre Group]
Management noted that speciality sales per square metre remained a key performance metric. Westfield Sydney recorded specialty sales of $26,949 per square metre for stores under 400 square metres. This figure ranked among the highest in the portfolio.
Trade Area Retail Expenditure and Consumer Spending Power
The 2025 Property Compendium highlights strong retail expenditure levels across primary trade areas. Westfield Sydney’s total trade area retail expenditure reached $94.8 billion in 2025. Its main trade area accounted for $38.1 billion of that spend.
Westfield Miranda’s total trade area retail expenditure reached $10.8 billion in 2025. The centre’s main trade area delivered per capita retail spending of $20,127. That level sits 19 percent above the Sydney metropolitan average of $16,852.

Westfield Miranda’s main trade area recorded per capita retail spending above the Sydney metropolitan average. [Scentre Group]
In Western Australia, Westfield Carousel reported total trade area expenditure of $8.9 billion in 2025. Main trade area spending reached $4.5 billion. The centre also recorded annual per capita retail spend of $19,295, which exceeds the Sydney metro benchmark.
New Zealand assets also showed solid fundamentals. Westfield Newmarket reported total trade area expenditure of $13.6 billion. Annual per capita spending in its main trade area reached $19,954, 14 percent above the Auckland regional average of $17,510.
Asset Values and Portfolio Book Value Strength
The portfolio’s book values reflect the scale of the group’s retail property holdings. Westfield Sydney holds a book value of $4.359 billion. Westfield Bondi Junction carries a book value of $2.376 billion. Westfield Parramatta reports $2.174 billion in asset value.

Westfield Bondi Junction remains one of the group’s highest-valued assets within the Australian portfolio. [IStock]
These figures illustrate concentration in major metropolitan centres with strong demographic support. Westfield Miranda reports a book value of $1.29 billion, while Westfield Doncaster stands at $1.395 billion.
Management confirmed that the portfolio includes 42 destinations across Australia and New Zealand. The group continues to focus on high-productivity assets in strategic urban corridors. These centres attract strong household incomes and above-average per capita spending.
Average household income within many trade areas remains elevated. Westfield Hornsby’s main trade area reports average household income of $175,800. Westfield Warringah Mall reports $176,800. High-income catchments support discretionary retail categories and speciality tenants.
Speciality Store Productivity and Sales Density Performance
Specialty store productivity remains a core driver of portfolio performance. Westfield Miranda recorded average specialty store sales of $2.143 million in 2025. Westfield Parramatta delivered $2.195 million per specialty store.
Westfield Sydney’s average specialty store sales reached $4.086 million. This figure reflects strong luxury, dining, and experiential tenant performance in the CBD location.
Specialty sales per square metre also improved in several centres. Westfield Penrith reported $16,249 per square metre in 2025. Westfield Bondi Junction recorded $14,405 per square metre. These metrics signal efficient space utilisation and sustained shopper traffic.
Management attributes sales density growth to curated tenant mixes and redevelopment initiatives. Centres that completed refurbishments in recent years reported stronger specialty performance compared with pre-upgrade periods.
Redevelopment Projects and Capital Investment Activity
Capital investment remains part of the portfolio strategy. Several centres completed redevelopment programs in recent years, which continue to support rental growth and sales uplift.
Westfield Mt Druitt completed a $55 million redevelopment that improved dining and retail offerings. Westfield Penrith finalised a $33 million development in 2022, adding new retail and lifestyle components.
Westfield Newmarket in New Zealand completed a NZ$790 million redevelopment in 2019. The centre now serves a trade area population exceeding 460,000 residents. Westfield Carousel previously underwent a $160 million redevelopment that expanded dining and entertainment space.
Management stated that redevelopment programs focus on increasing dwell time and customer engagement. Enhanced food precincts, upgraded common areas, and experiential retail concepts form part of that strategy.
Demographic Profile and Income Levels Support Retail Demand
Demographic data within the compendium indicates strong income levels across multiple trade areas. Westfield Miranda’s main trade area reports 37 percent of households earning more than $156,000 annually.
Westfield Southland reports annual per capita spending of $19,279, well above the Melbourne metropolitan average of $16,618. Westfield Carousel reports $21,022 per capita spending, 14 percent above the Perth metro average.
Centres in metropolitan Sydney consistently report above-average retail spending. Westfield Sydney shows per capita spending of $19,125. Westfield Woden reports $19,572 per capita, exceeding the broader metro benchmark.
These figures show that many Westfield locations sit within high-income corridors. Strong employment participation and dense residential catchments continue to drive foot traffic and tenant turnover.
Also Read: Woodside Energy Posts Record Production as Shares Surge on Strong Full-Year Results
Outlook for 2026 Retail Property Performance
The 2025 Property Compendium outlines a portfolio that continues to generate stable sales growth and strong trade area expenditure. Speciality sales momentum and high per capita spending support tenant performance.
Management has emphasised operational focus on asset quality, customer experience, and leasing strategy. High-productivity centres in major metropolitan markets remain central to the group’s positioning.
As consumer spending patterns evolve, the portfolio’s concentration in high-income trade areas may provide resilience. The 2025 performance data indicates consistent demand across flagship destinations under the Westfield brand.
The group’s 42-centre portfolio now reflects a combined mix of strong retail sales, elevated per capita spending, and ongoing capital investment. These factors position the portfolio to maintain stable performance heading into 2026.
FAQs
- What does Scentre Group do?
Ans: Owns and operates Westfield shopping centres in Australia and New Zealand. - How many Westfield centres does Scentre Group own?
Ans: 42 centres across Australia and New Zealand. - What were Scentre Group’s retail sales results in 2025?
Ans: Many centres saw year-on-year sales growth in 2025. - What is moving annual turnover (MAT) sales?
Ans: Total retail sales over a rolling 12-month period. - What is trade area retail expenditure?
Ans: Total spending by residents in a centre’s catchment area. - How does Scentre Group measure specialty store performance?
Ans: By average sales per store and sales per square metre. - What is the value of Scentre Group’s property portfolio?
Ans: Multi-billion-dollar assets in high-income metropolitan areas. - Does Scentre Group invest in redevelopment projects?
Ans: Yes, it upgrades dining, retail, and lifestyle precincts. - Who owns the Westfield brand in Australia?
Ans: Scentre Group. - Where is Scentre Group listed?
Ans: On the Australian Securities Exchange (ASX: SCG).