
Fletcher Building Limited (ASX:FBU) has released its 2025 quarterly report, showing that the company continues to face challenges in New Zealand and Australia. The report, dated 13 October 2025, includes the company’s first-quarter results for the 2026 financial year (Q1 FY26).
The report shows that there are still market headwinds, and in addition to that, there are decreasing trading volumes and margin pressures experienced by the main business divisions. The management of Fletcher Building has admitted that the market is tough and demand is low, which has resulted in the operations being affected.
 Fletcher Building’s 2025 report shows ongoing challenges in Australia, New Zealand.
What Challenges Defined Fletcher Building’s Q1 FY26 Results?
Managing Director and CEO Andrew Reding characterized the first quarter as “tough” for the company. He pointed out that the weaker market demand and the competition were important reasons for the drop in sales volume. “The quarterly volumes reveal further decreases in trading volumes and continuous pressure on margins,” Reding pointed out. “Primary reasons for the weaker performance were the sustained lack of demand in major markets and the increased competition, especially in the New Zealand market.”
Fletcher Building’s Q1 FY26 results indicated that the company experienced poor demand in the residential and infrastructure sectors. The sectors have been affected particularly by the increase in costs and the delay in project starts, which has consequently lowered their growth expectations.
Light Building Products See Mixed Performance
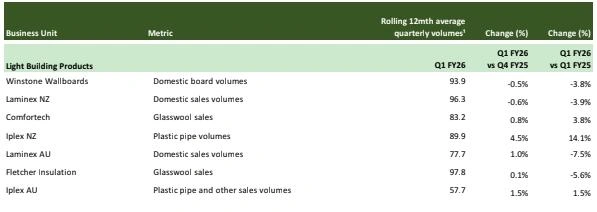
Per the report on the volume of Fletcher Building for Q1 FY26, the Light Building Products division displayed different results. Doing the comparison on a year-over-year basis, the volumes were below but there were indications of an improvement from Q4 FY25 when looking at it on a quarter-by-quarter basis.
Comfortech went up by 3.8% in volume compared to the previous corresponding period and Iplex NZ increased by 14.1% on the same basis. These numbers demonstrate a partial recovery in New Zealand, which is attributed to the increasing demand for insulation and piping solutions.
On the contrary, Australian operations had to face a more challenging situation. Laminex AU and Iplex AU both performed better than Q4 FY25, but experienced considerable drops compared to pcp. The division’s margins were variable but stable due to the production efficiency at Winstone Wallboards and the strict cost management.
 Fletcher Building Quarterly Volume Data
How Did Heavy Building Materials Perform In The Quarter?
The division of Heavy Building Materials experienced a remarkable decline in volumes. The reduction in Winstone Aggregates volumes amounted to 4.1% when compared to Q4 FY25 and 6.3% when compared to the same period last year. The decrease was due to the lessened activity in roading and infrastructure, which was the main reason for the overall slowdown.
Apart from this, Firth and Golden Bay – two important operations of the division – managed to keep their volumes about the same as last year. The company, however, still reported ongoing pressure on its profitability. The steel volumes went up slightly compared to Q4 FY25, but they were higher than the previous year’s figures. However, margins were further compressed, which is indicative of cost inflation and pricing competition.
The overall weakness of this segment reflects the difficulties of New Zealand’s infrastructure sector, which, due to delayed project approvals and tight budgets, has seen a drop in demand for aggregates and cement.
Distribution Division Faces Margin Pressure Despite Stable Volumes
Fletcher Building’s Distribution Division, which comprises PlaceMakers, announced unchanged sales volumes in the first quarter of FY26. Frame & Truss’s sales were the same as, but a little more than, the previous year.
On the other hand, the margins fell as the fight for market share increased in the retail building materials sector. The company mentioned that aggressive pricing and slow housing starts together exerted a negative influence on profits.
This segment’s success reflects the whole market, where the activity in the construction sector is very low and the builders are still using various means to reduce costs owing to the uncertain nature of the demand.
 Fletcher Building Market Share Trend
What Do The Residential Results Indicate For The Company?
Fletcher Building’s Residential division reported gains on 88 residential and apartment units in Q1 FY26, which was a bit less than the 90 units in Q1 FY25.
The firm stated that it was still keeping a very tight control over overheads in order to neutralize the effect of the low sales volumes. The market inventories are still high, which indicates that home buyers and investors are still very careful before making their decisions.
The low sales in the residential sector have made the company shift its sales strategy towards operational efficiency, cost management, and selective project delivery in order to keep making profits.
Outlook: How Will Fletcher Building Navigate The Coming Quarters?
Fletcher Building keeps a conservative view as it enters the next quarter. The firm is of the opinion that the market conditions will remain quite tough, especially in the areas of construction and infrastructure in New Zealand.
According to Andrew Reding, the CEO, some sectors have been able to get through the hard times with slight improvements, however, the still very low demand has been a continuous and major hindrance to the overall recovery of the industry. The company will continue to manage costs, enhance productivity, and protect margins in all the various business units.
The first quarter of the FY26 for Fletcher Building was marked by tough times in the beginning of the financial year. On the other hand, the implementation of the new strategic efficiency measures and the identification of selective growth in the key areas could turn the slow market into a pressure release valve.
Also Read: Life360 Shares Surge 13% After Record Q1 2025 Earnings
FAQs
- What is the biggest point of Fletcher Building’s Q1 FY26 report?
The biggest point is that the market is so weak that the trading volumes decline, and the margins are very tight.
- Which area was the best performer in Q1 FY26?
Iplex NZ is the business unit that performed best with the highest percentage of volume increase, 14.1%, as compared to the corresponding period of the previous year.
- How did the Residential sector do?
The Residential division reported profits from 88 units, which is a slight decrease from 90 units in the previous year Q1 FY25.