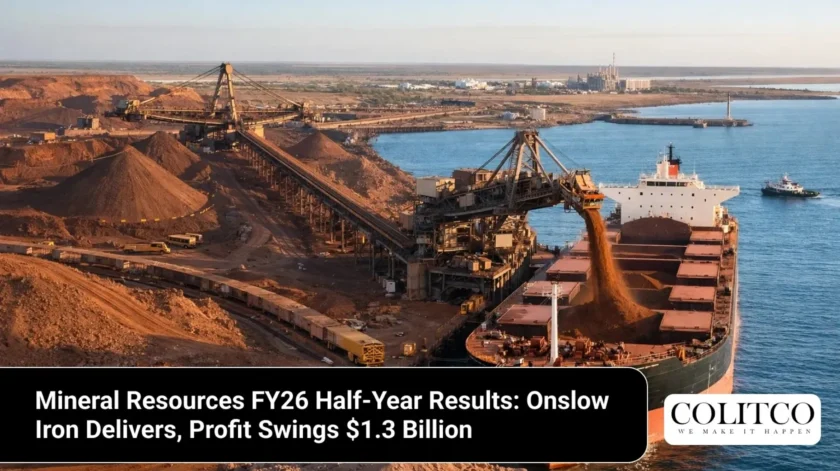
Mineral Resources Limited (ASX: MIN) has delivered one of the most dramatic earnings reversals in its history in the Mineral Resources FY26 half-year results. The Company swung from an attributable loss of $809 million in the first half of FY25 to an attributable profit of $495 million in 1H26, driven largely by Onslow Iron reaching nameplate capacity and supportive commodity prices.
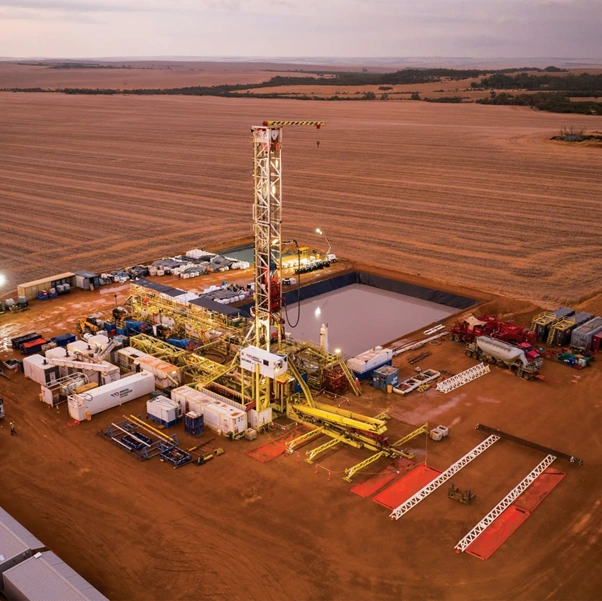
Figure 1: Mineral Resources drilling and site operations supporting Onslow Iron development [Mineral Resources Limited]
The Mineral Resources interim results confirm that this is no longer a business in crisis. Instead, the Company is rebuilding at speed, with Onslow Iron now established as the primary earnings engine and balance sheet repair firmly underway.
Mineral Resources FY26 Half-Year Results at a Glance
The Mineral Resources FY26 half-year results mark a full-period swing of $1.38 billion at the NPAT line. Revenue, earnings, and cash all moved sharply higher as Onslow Iron transitioned from a development project to a cash-generative operating asset.
- Revenue: $3,052M (+33% pcp)
- Statutory NPAT: $573M (1H25: -$807M)
- NPAT attributable to shareholders: $495M (+161% pcp)
- Underlying EBITDA: $1,167M (+286% pcp)
- Profit from operations: $1,031M
- Basic EPS: 251.4 cents
- Net tangible assets per share: $21.13
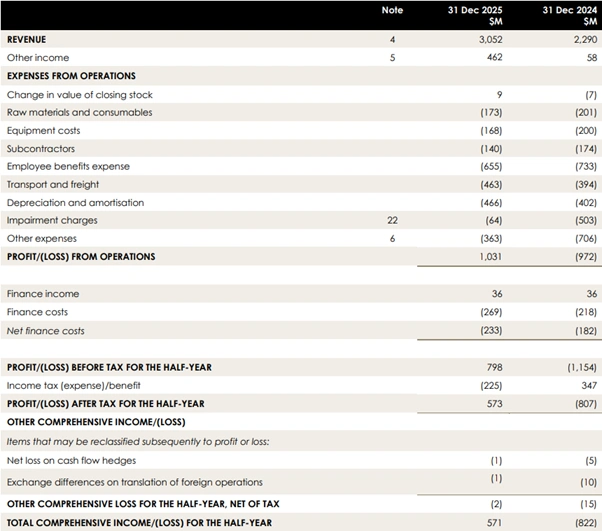
Figure 2: Mineral Resources consolidated income statement showing revenue growth and swing to profitability in H1 FY26 [Mineral Resources Limited]
One-off items included a $134M post-tax gain from the Onslow Iron haul road transaction, foreign exchange gains, asset disposals, and impairment charges.
MIN Half-Year Report Highlights – Onslow Iron Is Now the Engine Room
The story inside the Mineral Resources FY26 half-year results is Onslow Iron. The project, which was still ramping during 1H25, achieved nameplate capacity of 35 million tonnes per annum (Mtpa) in August 2025 and has not looked back.

Figure 3: Logistics corridor underpinning higher shipment volumes and cost efficiencies [Mineral Resources Limited]
Onslow Iron operating highlights for 1H26:
- Nameplate capacity of 35Mtpa achieved in August 2025
- Total shipments: 17.3M wet metric tonnes (wmt) on a 100% basis; 9.8M wmt attributable to the Group
- Average realised price: US$93/dmt, representing 89% realisation of the Platts 62% IODEX
- FOB costs: $52/wmt, down 32% on pcp, reflecting higher volumes and cessation of mine-to-ship ramp-up costs in September 2025
- Underlying EBITDA: $519M (1H25: $54M)
- Sixth and seventh transhippers arrivingin June and August 2026, respectively, lifting installed capacity towards 40Mtpa
Mineral Resources Interim Results – Lithium Rebounds but POSCO Deal Is the Real Story
Lithium was a drag on the business in 1H25. In the Mineral Resources FY26 half-year results, it is a contributor. Both Wodgina and Mt Marion delivered improved volumes, lower costs, and higher prices. The transformative event for this segment, however, is the binding agreement executed with POSCO Holdings Inc in November 2025.
Lithium segment highlights for 1H26:
- Underlying EBITDA: $167M (1H25: -$15M)
- Wodgina EBITDA: $113M
- Mt Marion EBITDA: $57M
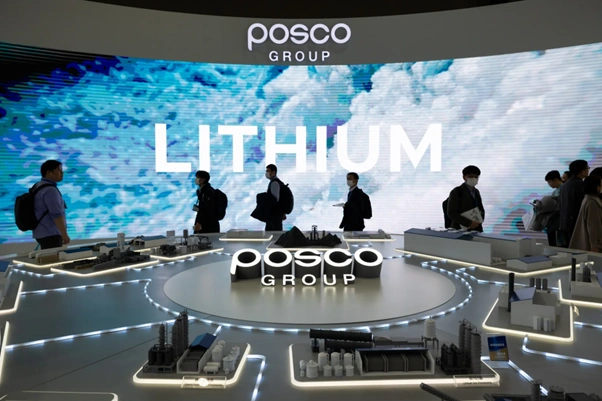
Figure 4: POSCO Group lithium showcase highlighting its strategic focus on downstream battery materials and global supply chain expansion [Bloomberg]
POSCO Transaction: On 12 November 2025, the Company executed a binding agreement with POSCO Holdings Inc for POSCO to acquire a 30% interest in the Group’s operational lithium businesses (Wodgina and Mt Marion, held via Li Holdco Pty Ltd) for total upfront cash consideration of US$765M. The transaction is subject to conditions precedent, including regulatory approvals.
Balance Sheet Strengthening, Dividend Deferred
The MIN half-year report highlights a management team that is making deliberate choices. With $1,438M in total liquidity and no near-term debt maturities, the Company is not under pressure.
Balance sheet position at 31 December 2025:
- Cash and cash equivalents: $638M (30 June 2025: $412M)
- Undrawn revolving credit facility: $800M
- Total liquidity: $1,438M
- Total assets: $11,928M (30 June 2025: $11,927M)
- Total liabilities: $7,716M (30 June 2025: $8,268M), down $552M
- Net assets: $4,212M (30 June 2025: $3,659M)
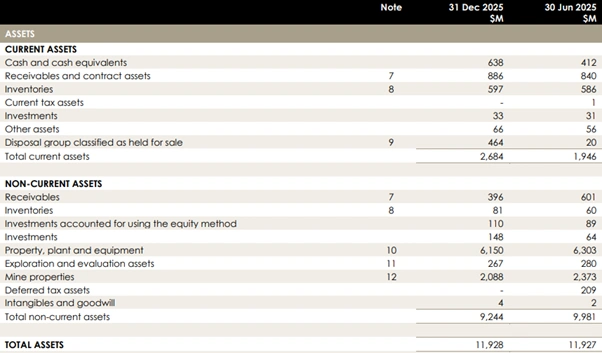
Figure 5: Mineral Resources balance sheet snapshot highlighting asset base and liquidity position as at 31 December 2025 [Mineral Resources Limited]
Debt structure – senior unsecured notes on issue at 31 December 2025:
- US$625M at 8.000%, maturing 1 November 2027
- US$1,100M at 9.250%, maturing 1 October 2028
- US$625M at 8.500%, maturing 1 May 2030
- US$700M at 7.000%, maturing 1 April 2031 (new issuance, replaced the US$700M May 2027 notes)
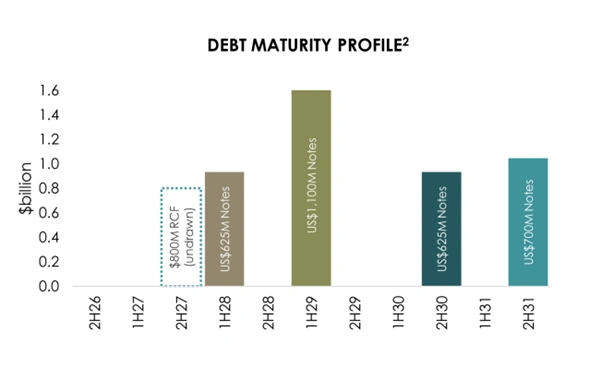
Figure 6: Mineral Resources debt maturity profile showing no major maturities before FY27 and extended tenor profile [Mineral Resources Limited]
Operating cash flow before interest and tax was $1,076M, up $1,552M on pcp. Net cash from operating activities was $880M. Net cash used in investing activities was $527M, including $333M in property, plant and equipment and $243M in mine development expenditure.
Share Price Snapshot
Mineral Resources Limited (ASX: MIN) is trading at $52.130 per share, giving the Company a market capitalisation of $10.68 billion. The stock has moved within a 52-week range of $14.050 to $65.790, reflecting a strong recovery following the turnaround delivered in the FY26 half-year results.
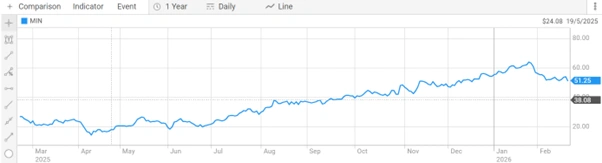
Figure 7: Mineral Resources share price performance over the past year on the ASX following earnings turnaround [ASX]
Safety Performance and Outlook
Mineral Resources recorded zero lost time injuries during 1H26, with a Lost Time Injury Frequency Rate (LTIFR) of 0.00. The rolling 12-month Total Recordable Injury Frequency Rate (TRIFR) was 2.93, an improvement reflecting the transition of Onslow Iron from construction to steady-state operation.
Outlook – what the Company has guided for 2H26 and FY26:
- FY26 guidance reaffirmed across all segments, including lithium volumes upgraded in Q2
- Mining Services forecast to deliver record production of 305 to 325Mt in FY26
- Onslow Iron FOB costs expected at the low end of $54 to $59/wmt guidance range
- Pilbara Hub costs expected to decline as production transitions from Wonmunna to Lamb Creek
- Wodgina’s third processing train to operate opportunistically in 2H26; improved ore access expected from Q2 FY27
- Mt Marion material movement to increase in 2H26
- POSCO transaction completion expected in 2H26, accelerating deleveraging
- Target: 2.0x net leverage by the end of FY26
- No material events after the reporting period
Frequently Asked Questions
Q1. Why did Mineral Resources swing from a $809M loss to a $495M profit in one year?
The primary driver was Onslow Iron achieving its 35Mtpa nameplate capacity in August 2025. This asset generated $519M in Underlying EBITDA in 1H26 compared to $54M in 1H25.
Q2. Why did Mineral Resources not pay a dividend?
The Board elected not to declare an interim dividend for FY26 to prioritise balance sheet strengthening and maintain a strong liquidity position.
Q3. What is the POSCO transaction, and why does it matter?
On 12 November 2025, Mineral Resources executed a binding agreement for POSCO Holdings Inc to acquire a 30% interest in the Company’s Wodgina and Mt Marion lithium operations for US$765M.
Q4. What is the Mineral Resources debt position, and when does it mature?
Total borrowings are $5,516M. The Company has no senior unsecured note maturities prior to November 2027.


