The Dow Jones Industrial Average stands as one of the oldest and most-watched market benchmarks in the world. Yet few investors understand how benchmarks like the Dow actually shape their portfolio performance and investment decisions. Recent market concentration has raised fresh questions about whether these traditional measures still serve investors well.
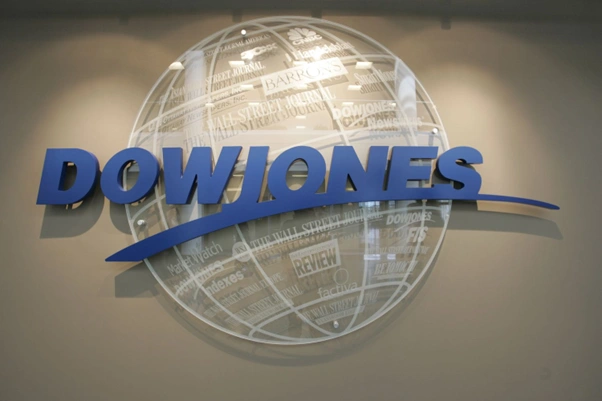
Figure 1: Dow Jones branding at S&P Dow Jones Indices, representing one of the world’s most closely followed equity benchmarks. [Source: Investopedia]
This article explains how benchmarks work, why the Dow Jones impact on portfolio construction matters, and what investors should track beyond headline index numbers. We focus on practical insights and clear steps to assess whether your portfolio aligns with your actual goals.
What the Dow Jones Industrial Average Really Measures
The Dow Jones Industrial Average is made up of 30 major U.S. companies chosen by an index committee overseen by S&P Dow Jones Indices. Charles Dow launched the first version in 1884 as a simple way to gauge economic health. The modern Dow emerged in 1896 and remains price-weighted, meaning higher-priced stocks carry more influence regardless of Company size.
This structure differs from market-cap-weighted indices like the S&P 500, which launched in 1957 and measures 500 companies based on their total market value. The FTSE 100 Index debuted in 1984 to track Britain’s largest firms. THE MSCI EAFE Index arrived in the late 1960s to cover developed markets outside North America. Each benchmark uses different rules, weighting methods, and review schedules, which means they behave differently even when tracking similar markets.
How Benchmarks Shape Investment Decisions
Understanding how the Dow affects investors starts with recognising that benchmarks are not neutral. They set standards for measuring success, which drives trillions of dollars in investment flows. Passive index funds automatically buy stocks in proportion to benchmark weights. When a Company’s weight rises, these funds must add shares. When it falls, they must sell.

Figure 2: Bull and bear figures illustrating market cycles and investor sentiment tied to Dow Jones movements. [Source: Corporate Finance Institute]
This creates a feedback loop. Strong performance increases a stock’s benchmark weight, which triggers more buying, which pushes prices higher. The Dow Jones impact on portfolio construction is direct: passive funds tracking the Dow must hold the 30 stocks in the index, regardless of valuation or fundamentals. Active managers face pressure to match benchmark exposure or risk underperformance if those names rally.
Rising Concentration Raises New Risks
Equity markets are now more heavily concentrated than at any point in recent decades. In early 2025, the ten largest stocks in the S&P 500 accounted for close to 40 per cent of the index’s total market value. This compares with roughly 20 to 28 per cent from 1990 to 2010. Apple, Microsoft, NVIDIA, Amazon, Alphabet, Meta, and Tesla now drive most benchmark returns.

Figure 3: Top 10 stock concentration across global equity markets, highlighting rising benchmark concentration risk. [Source: FactSet]
The Russell 1000 Growth Index shows even sharper concentration. The top 10 names represent 59 per cent of index weight and contributed 73 per cent of returns in calendar year 2025. The MSCI World Index, often used as a global equity benchmark, sees its top 10 holdings account for about 27 per cent of total weight. This means a handful of U.S. technology companies now drive much of “global” equity performance tracked by international benchmarks.
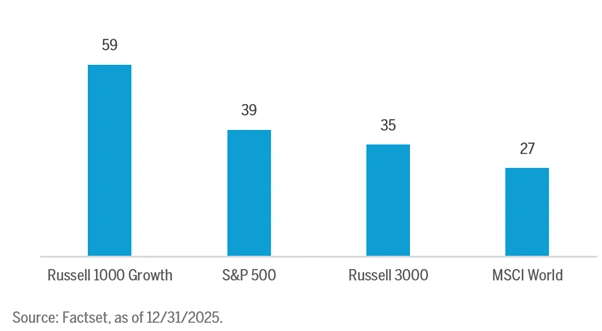
Figure 4: Top 10 stock concentration across major indices, showing how a small group of companies drives index returns. [Source: Brown Advisory]
This concentration matters because it amplifies risk. When a small group of stocks dominates, portfolio outcomes depend heavily on whether those specific companies continue to deliver. If leadership shifts or these names stumble, the Dow Jones impact on portfolio losses can be sharp and sudden.
Benchmarks Do Not Always Reflect Economic Reality
The Dow Jones Industrial Average was created to track market performance, not underlying economic drivers like productivity, employment, or innovation. This gap has widened steadily as markets have evolved. Recent years have seen equity indices rise sharply even as broader economic measures, such as GDP growth and wage trends, remain subdued.
Ireland posted GDP growth above 5 per cent from 1998 to 2020 but delivered barely 1 per cent in total equity returns. Several emerging markets achieved double-digit returns despite slower economic expansion. Using benchmarks as a proxy for economic vitality can oversimplify reality. This disconnect is magnified by growing concentration, where performance increasingly reflects a handful of mega-cap stocks rather than the broader economy.
Beyond Benchmark Comparisons
Investors are increasingly complementing benchmark comparisons with measures that align more closely to long-term objectives. These include absolute returns, capital preservation, and risk-adjusted outcomes. For pension funds, success is often measured by meeting liabilities rather than outperforming an index. Investment approaches that prioritise loss control tend to build wealth more consistently, even when they underperform during short-lived market surges.
Figure 5: Dow Jones Industrial Average price display, reflecting real-time market performance tracked by investors worldwide. [Source: Corporate Finance Institute]
The Dow Jones impact on portfolio assessment matters less when investors focus on what actually drives their financial goals. A portfolio that falls 33 per cent must gain 50 per cent just to break even. Preventing large losses plays a bigger role in long-term growth than participating in every temporary market upswing. This perspective shifts attention from relative rankings to resilience and consistency.
What Investors Should Watch
Monitor concentration levels in your portfolio and key benchmarks. Review whether your holdings align with your risk tolerance and time horizon. Avoid over-concentrating in a small number of names simply because they dominate an index. Consider complementary measures like absolute return targets, drawdown limits, and alignment with financial goals.
Set alerts for major index rebalancing events, as these can trigger large flows. Keep a clear record of investment choices and the reasoning that supports them. If a benchmark becomes too concentrated, assess whether it still reflects the opportunity set you want to access. Diversification across sectors, geographies, and Company sizes can reduce the risk of narrow leadership reversals.
Final Thoughts
The Dow Jones Industrial Average and other benchmarks remain important reference points for investors. However, rising concentration has changed how these measures behave and what they represent. Today’s benchmarks are more heavily influenced by a small group of technology companies than at any point in recent decades.
Understanding how the Dow affects investors requires looking beyond headline numbers to the underlying structure, concentration levels, and whether the benchmark aligns with your actual goals. The Dow Jones impact on portfolio construction is real, but it should not be the only measure of success. Absolute returns, risk management, and long-term compounding matter more for building wealth over time.
As markets evolve, so should the way investors define achievement. Moving beyond narrow comparisons to include measures that reflect resilience and alignment with objectives can provide a fuller picture of portfolio health. The Dow Jones Industrial Average offers valuable information, but it is one data point among many that should guide investment decisions.
FAQs
Q1. What is the Dow Jones Industrial Average?
Ans. The Dow Jones Industrial Average tracks 30 large U.S. companies selected by a committee. It uses price weighting, meaning higher-priced stocks carry more influence regardless of Company size.
Q2. How does the Dow affect investor portfolios?
Ans. Benchmarks like the Dow drive investment flows because passive funds must match index weights. This creates feedback loops where strong performance triggers more buying, which can amplify both gains and losses.
Q3. Why does market concentration matter?
Ans. High concentration means a small group of stocks drives most benchmark returns. If those names stumble, portfolio losses can be sharp. Concentration also embeds sector bias and makes diversification harder to achieve.
Q4. Should investors still use benchmarks?
Ans. Yes, but not exclusively. Benchmarks provide context, but investors should also track absolute returns, drawdown limits, and alignment with long-term goals to assess portfolio health fully.