
Cleanaway Waste Management Limited (ASX: CWY) delivered a strong set of numbers for the six months ended 31 December 2025. Growth came from two places: the core solid waste business executing well on price and efficiency, and the Contract Resources acquisition landing ahead of expectations.
Figure 1: Cleanaway collection vehicle operating during evening service run [Cleanaway Waste Management Limited]
The result was strong enough for the Company to upgrade its full-year underlying EBIT guidance. CEO and Managing Director Mark Schubert said the upgrade reflects the underlying strength of the business and confidence in the second half outlook.
Key Financial Metrics from the Cleanaway H1 Results 2026
The Cleanaway H1 Results 2026 show broad-based growth across revenue, earnings and returns:
- Gross revenue up 13.7% to $2,205.8 million
- Net revenue up 13.0% to $1,875.3 million
- Underlying EBITDA up 14.6% to $439.3 million
- Underlying EBIT up 16.9% to $228.2 million
- Underlying EBIT margin up 40 basis points to 12.2%
- Underlying NPAT up 17.8% to $109.7 million
- EPS up 16.7% to 4.9 cents; EPSA up 18.2% to 5.2 cents
- Return on Capital Employed up 80 basis points to 9.4%
- Return on Invested Capital up 60 basis points to 6.3%
- Interim dividend of 3.35 cents per share, fully franked, up 19.6%
- FY26 underlying EBIT guidance upgraded to $480 million to $500 million

Figure 2: Cleanaway H1 FY26 financial highlights showing revenue, earnings and dividend growth [Cleanaway Waste Management Limited]
Statutory Result and Significant Items in the Cleanaway H1 Results 2026
The Cleanaway half-year results 2026 on a statutory basis look different. Statutory EBIT fell 21.2% to $137.2 million, and statutory NPAT declined 49.1% to $37.3 million, weighed down by $91.0 million in significant and non-recurring items.

Figure 3: Breakdown of significant and non-recurring items impacting statutory results in H1 FY26 [Cleanaway Waste Management Limited]
Those items included:
- $37.1 million non-cash impairment of Construction and Demolition assets and the Circular Plastics Australia investment
- $12.1 million provision for legacy waste treatment costs at a former Toxfree Oil and Technical Services site
- $11.9 million acquisition and integration costs for Contract Resources and Citywide Waste
- $11.7 million related to the ongoing IT transformation under Blueprint 2030
- $8.4 million in payroll remediation obligations
- $6.5 million in one-off restructuring costs from the strategy refresh
- $3.3 million in costs net of insurance recoveries related to Christie Street

Figure 4: Free cash flow bridge illustrating key drivers from H1 FY25 to H1 FY26 [Cleanaway Waste Management Limited]
Free Cash Flow declined 21.5% to $74.2 million. The decrease primarily reflects $58.7 million in catch-up tax payments, higher interest expense from acquisition debt funding and cash costs associated with restructuring and integration. A significantly stronger second-half Free Cash Flow outcome is projected.
Cleanaway Earnings 2026: Segment Performance Breakdown
Solid Waste Services delivered net revenue growth of 7.5% to $1,256.7 million and EBIT growth of 11.0% to $196.7 million, with margins expanding to 15.7%. Performance was supported by pricing discipline, efficiency gains and strong landfill and CDS contributions.
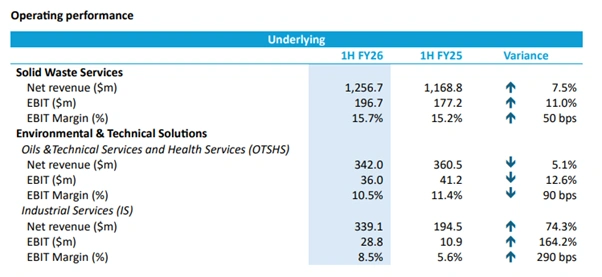
Figure 5: Cleanaway H1 FY26 operating performance by segment, including Solid Waste, ETS and Industrial Services [Cleanaway Waste Management Limited]
Environmental and Technical Solutions saw net revenue decline 5.1% to $342.0 million, and EBIT fall 12.6% to $36.0 million, reflecting Health Services contract impacts and temporary disruption, partly offset by strong Oils and Technical Services performance.
Industrial Services outperformed, with net revenue up 74.3% to $339.1 million and EBIT up 164.2% to $28.8 million, driven by a strong five-month contribution from Contract Resources and early integration benefits.
Dividend, Balance Sheet and Capex Highlights from the Cleanaway H1 Results 2026
The Board declared a fully franked interim dividend of 3.35 cents per share, up 19.6% on the prior period. It will be paid on 16 April 2026 to shareholders on the register on 12 March 2026, at a payout ratio of 68.4% of underlying NPAT. The Dividend Reinvestment Plan remains active with no discount.
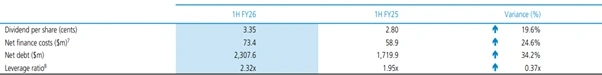
Figure 6: Dividend, net debt and leverage ratio comparison between H1 FY26 and H1 FY25 [Cleanaway Waste Management Limited]
- Net debt increased to $2,307.6 million from $1,719.9 million in the pcp, reflecting acquisition funding
- Leverage ratio of 2.32x with $260 million in committed debt headroom
- Weighted average debt maturity of 4.7 years
- US private placement notes drawn September 2025, fully hedged into Australian dollars
- Clean Energy Finance Corporation facility refinanced with a new seven-year tenor to November 2032
Figure 7: Total capital expenditure breakdown by category across recent half-year periods [Cleanaway Waste Management Limited]
Total capital expenditure, including non-cash leases, was $162.0 million for the half. Full year FY26 capex guidance remains unchanged at approximately $415 million, with capital intensity on a declining trajectory.
Cleanaway Earnings 2026: Strategy Refresh and Cost Savings Programme
Cleanaway updated its refreshed strategy under Blueprint 2030, focused on customer value, operational efficiency and free cash flow generation. The Company expects at least $35 million in annualised indirect cost savings from FY27, with $15 million to be realised in the second half of FY26.
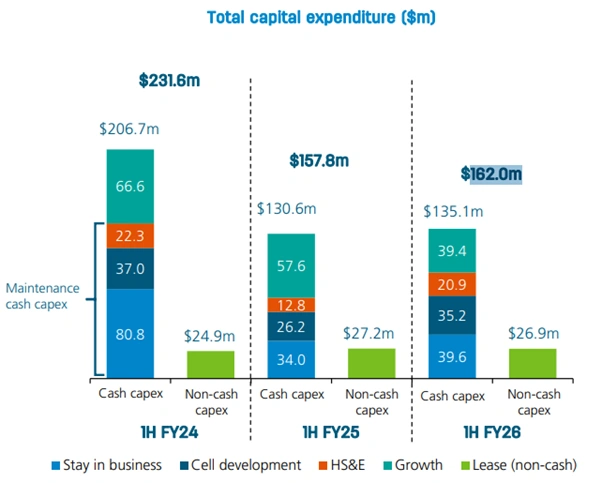
Figure 8: Aerial view of a Cleanaway operational facility and fleet base [Cleanaway Waste Management Limited]
Safety initiatives continued, including the rollout of fleet monitoring and AI-based pedestrian detection systems, with injury rates showing significant improvement.
Cleanaway Half-Year Results 2026: FY26 Outlook and Guidance
Cleanaway upgraded its FY26 underlying EBIT guidance to between $480 million and $500 million. The Company has a clear line of sight to the drivers and says positive operational momentum supports the outlook as it enters the second half.
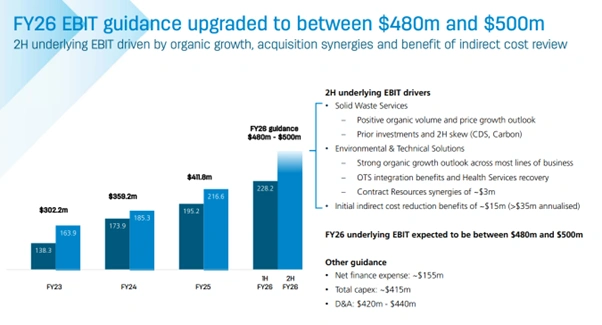
Figure 9: FY26 underlying EBIT guidance upgrade and key second-half earnings drivers [Cleanaway Waste Management Limited]
Second-half underlying EBIT drivers:
- Positive organic volume and price growth in Solid Waste Services with typical second-half seasonal skew
- Robust performance across most Environmental and Technical Solutions business lines, including OTS integration benefits and Health Services recovery
- Contract Resources synergies of approximately $3 million
- Initial indirect cost reduction benefits of approximately $15 million
Share Price Performance
Cleanaway Waste Management Limited (ASX: CWY) last traded at $2.595 per share. The 52-week range is $2.360 to $2.960 per share. Market capitalisation is approximately $5.37 billion.
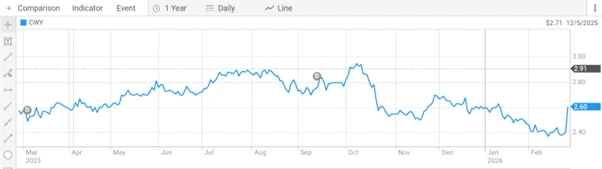
Figure 10: Cleanaway Waste Management Limited (ASX: CWY) one-year share price performance chart [ASX]
Investor Outlook
The Cleanaway H1 Results 2026 guidance upgrade and consistent underlying earnings growth give the Company a clear second-half narrative. Key watchpoints for investors:
- Second-half free cash flow recovery as catch-up tax payments normalise, with H2 tax instalments expected between $48 million and $53 million
- Health Services revenue turnaround following Queensland facility restoration and tender rebase
- Contract Resources and Citywide integration synergy delivery
- Progress on $35 million annualised indirect cost savings from FY27
- Investor Strategy Briefing on 21 April 2026
- Net debt trajectory and leverage ratio movement as acquisition funding is absorbed
- FY26 full year underlying EBIT delivery within the $480 million to $500 million guidance range
Frequently Asked Questions
Q1. What were the Cleanaway H1 Results 2026 key financial headlines?
Ans. Cleanaway H1 Results 2026 reported 13.7% revenue growth, underlying EBIT up 16.9% to $228.2m, underlying NPAT up 17.8% to $109.7m and a 3.35c fully franked interim dividend.
Q2. Why did Cleanaway upgrade its FY26 guidance in the Cleanaway earnings 2026 update?
Ans. The Cleanaway earnings 2026 guidance was lifted to $480–$500m due to strong first-half performance and confidence in second-half growth and cost savings.
Q3. Why did statutory profit fall in the Cleanaway half-year results 2026?
Ans. Statutory NPAT fell 49.1% to $37.3m due to $91.0m in significant items, including impairments and acquisition-related costs.
Q4. How did Contract Resources perform in the Cleanaway H1 Results 2026?
Ans. Contract Resources delivered a $17.5m five-month EBIT contribution at an 11.1% margin, exceeding expectations.